---
metadata:
- name: generator
content: Diplodoc Platform v5.63.0
alternate:
- en/charts/editor/quickstart/from-api-connector
- ru/charts/editor/quickstart/from-api-connector
- href: en/charts/editor/quickstart/from-api-connector.md
type: text/markdown
title: Markdown version
csp:
- script-src:
- https://mc.yandex.ru
img-src:
- https://mc.yandex.ru
connect-src:
- https://mc.yandex.ru
- wss://mc.yandex.ru
child-src:
- 'blob:'
- https://mc.yandex.ru
frame-src:
- 'blob:'
- https://mc.yandex.ru
frame-ancestors:
- 'blob:'
- https://mc.yandex.ru
canonical: en/charts/editor/quickstart/from-api-connector.html
title: Creating a table via API
description: Follow this guide to build a table based on API Connector in Editor.
vcsPath: en/charts/editor/quickstart/from-api-connector.md
---
# Creating a table via API
Follow this guide to build a table in Editor based on an API Connector connection.
You will use a static JSON file located at `https://storage.yandexcloud.net/datalens-public-demo-assets/data/mtcars.json` as your data source, but the process is similar for full-blown APIs.
## Getting started {#before-you-begin}
To get started with DataLens, follow [this deployment guide](../../../concepts/create-instance.md).
## Create a workbook {#create-workbook}
1. Go to the DataLens home page.
1. In the top-right corner, click **Create** → **Create workbook**.
1. Enter `Tutorials` for the [workbook](../../../workbooks-collections/index.md) name.
1. Click **Create**.
## Create an API Connector connection {#create-api-connector}
1. Navigate to the workbook created in the previous step and click **Create** → **Connection**.
1. Under **Files and services**, select **API Connector**.
1. Configure the connection as follows:
* **Host name**: `storage.yandexcloud.net`.
* **Port**: `443`.
* **URL path**: `datalens-public-demo-assets/data/`.
Leave the other parameters unchanged.
1. Click **Create connection**. Enter a connection name and click **Create**.
1. Go to the `Tutorials` workbook and find the new connection on the **Connections** tab.
1. Copy the connection ID by clicking → **Copy ID** next to it. The ID will be copied to the clipboard.
## Create a chart in Editor {#create-chart}
1. In the workbook, click **Create** → **Chart in Editor** in the top-right corner. On the page that opens, select the **Table** visualization type.
1. Link the chart with the connection by navigating to the **Meta** tab and adding the connection ID to `links`:
```javascript
{
"links": {
"mtcars": ""
}
}
```
Where:
* ``: Connection ID copied in the previous step.
* `mtcars`: Any alias name you assign to the connection and use to request chart data from the source.
{% note info %}
You need the **Meta** tab to describe service information about the list of related entities. This information is used to figure out what connections and datasets the chart is related to, as well as for the related objects dialog, when copying a workbook and when publishing to Public.
{% endnote %}
1. Get data from the data source. To do this, go to the **Source** tab and specify:
```javascript
module.exports = {
mtcars: {
// Naming the connection we take data from
// Using here the name we gave to the connection on the Meta tab
apiConnectionId: Editor.getId("mtcars"),
// Specifying the path to the API method/page in the source
path: "/mtcars.json",
// Request method
method: "GET",
}
};
```
1. Clear the contents of the **Config** tab: it contains a template that is not relevant to our example.
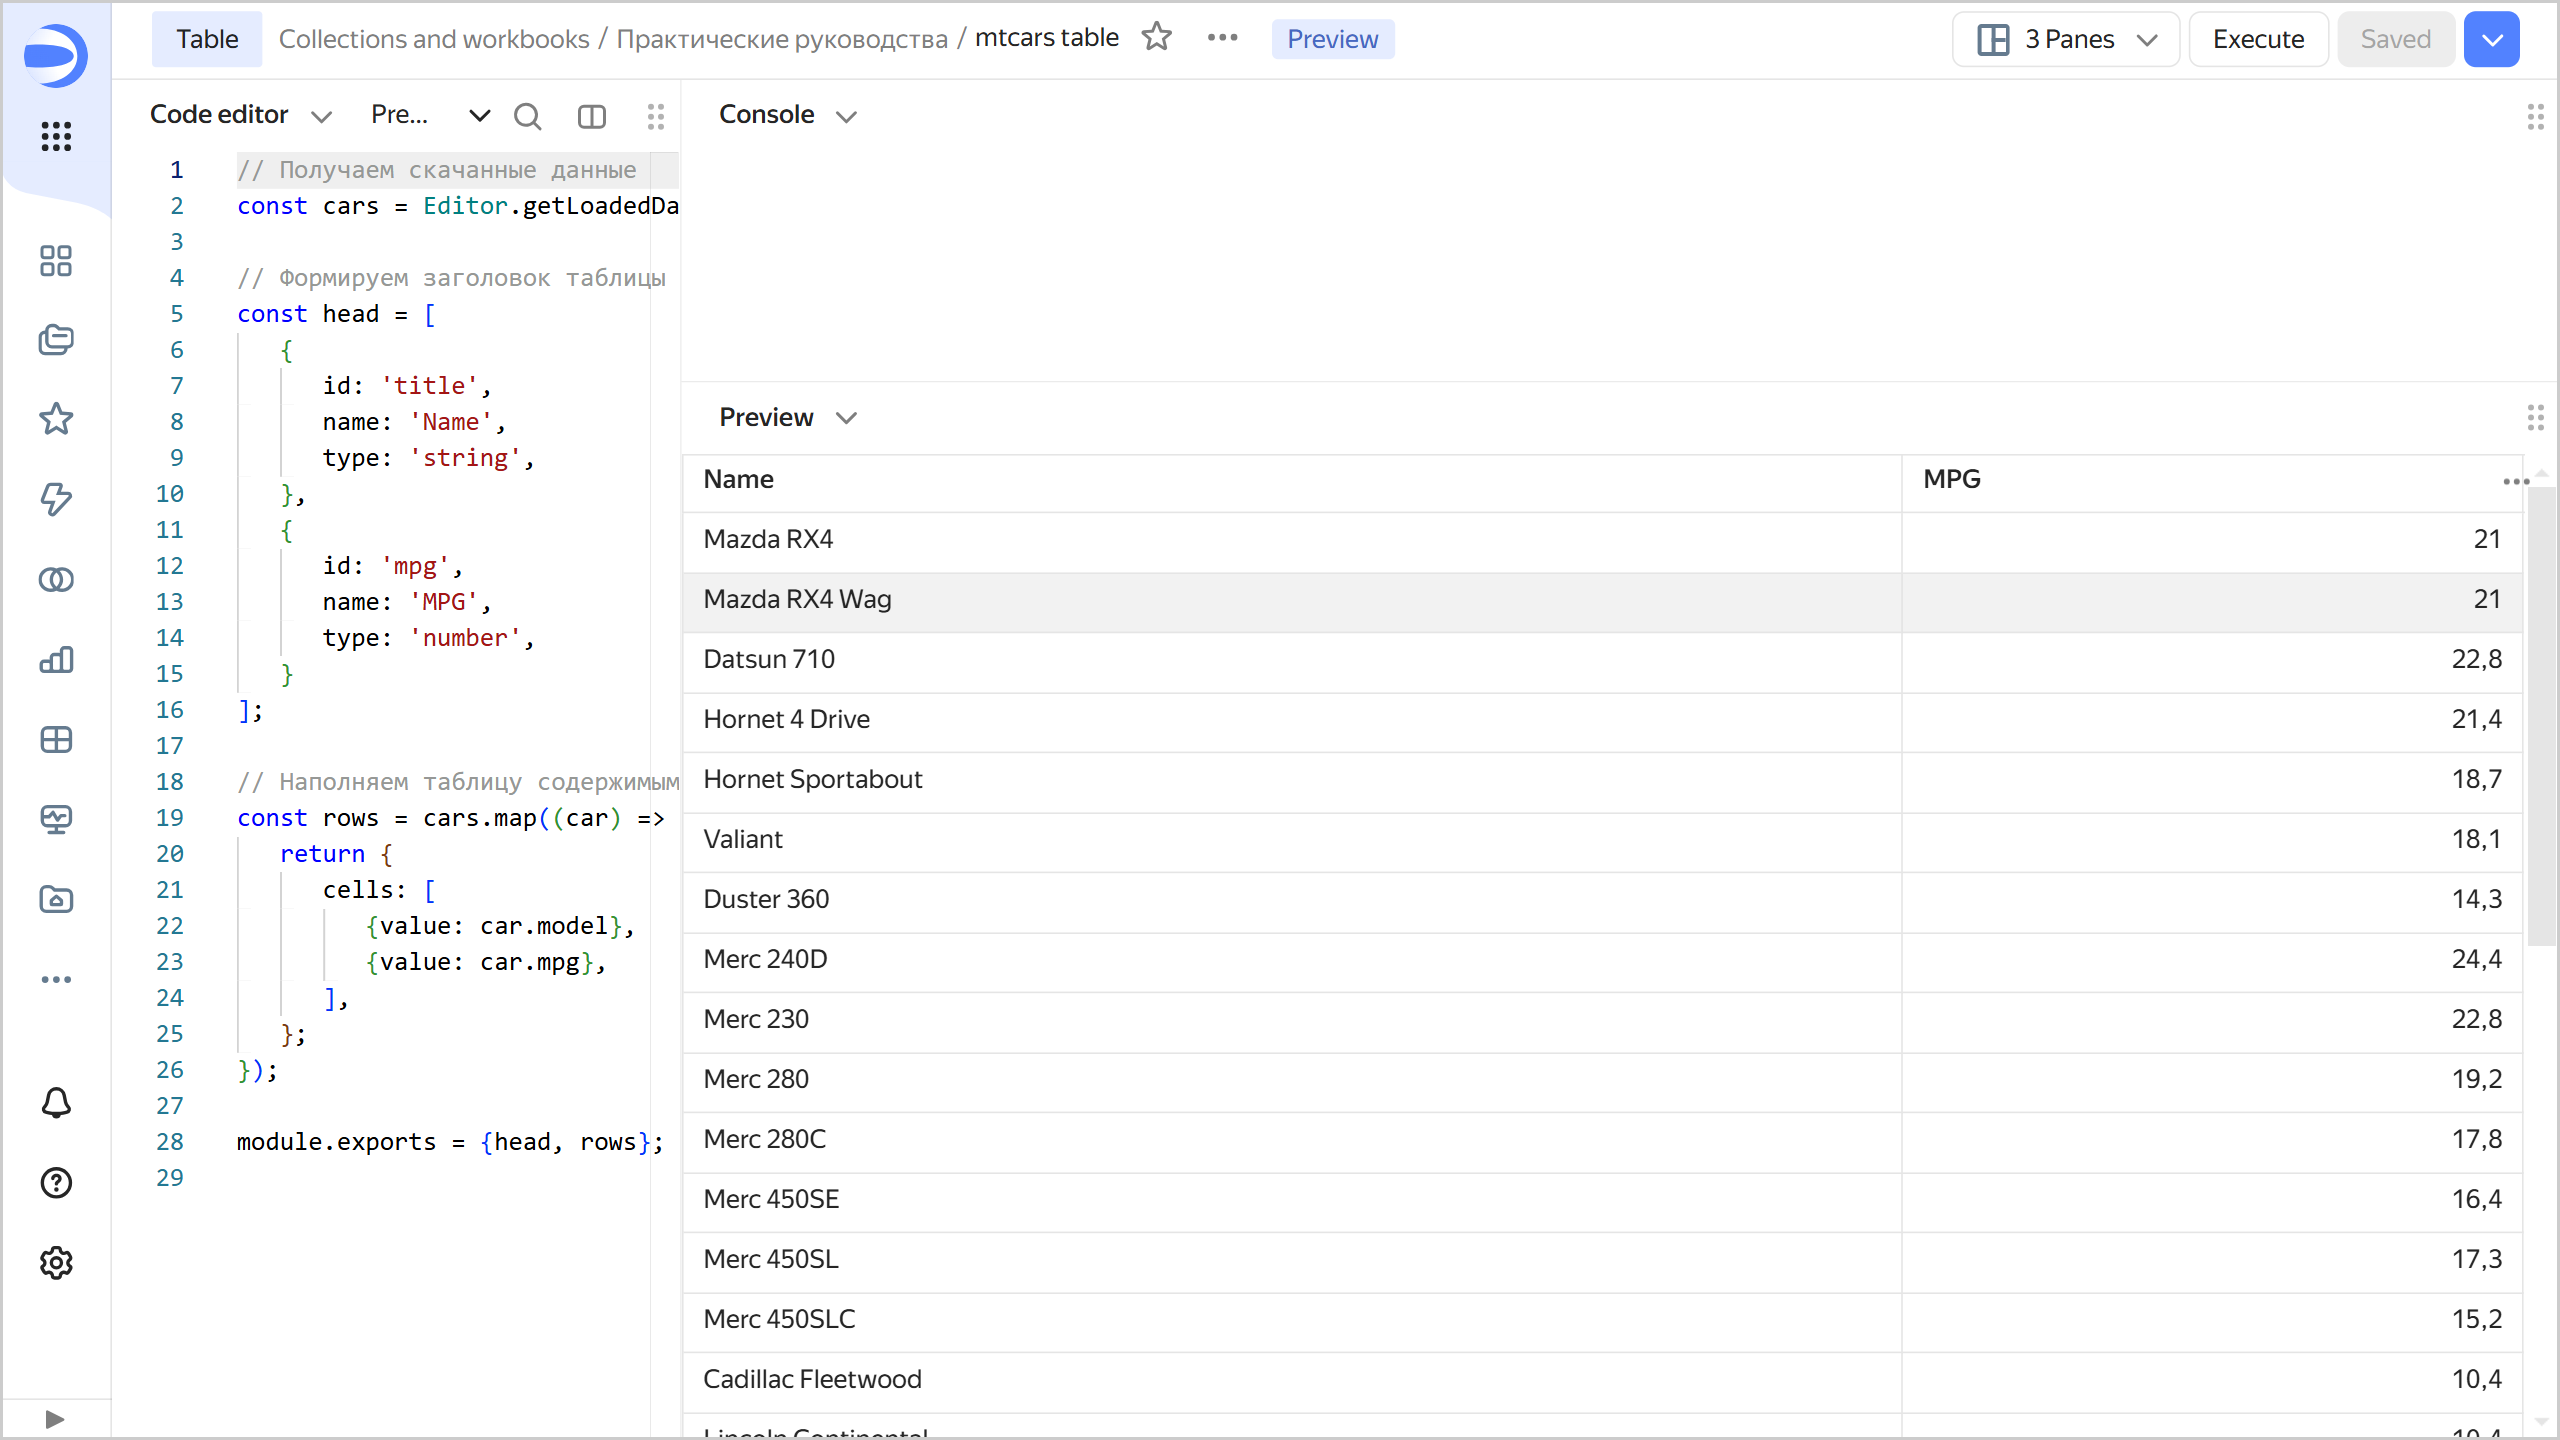
1. On the **Prepare** tab, create a table:
```javascript
// Getting the downloaded data
const cars = Editor.getLoadedData().mtcars.data.body.cars;
// Creating a table header and describing column types
const head = [
{
id: 'title',
name: 'Name',
type: 'string',
},
{
id: 'mpg',
name: 'MPG',
type: 'number',
}
];
// Populating the table
const rows = cars.map((car) => {
return {
cells: [
{value: car.model},
{value: car.mpg},
],
};
});
module.exports = {head, rows};
```
1. At the top of the chart, click **Execute**. The preview area will display a simple table displaying the data received from the JSON API.
1. To save a chart, click **Save** in the top-right corner and enter a name for the chart.