---
metadata:
  - name: generator
    content: Diplodoc Platform v5.63.0
alternate:
  - en/concepts/chart/data-export
  - ru/concepts/chart/data-export
  - href: en/concepts/chart/data-export.md
    type: text/markdown
    title: Markdown version
csp:
  - script-src:
      - https://mc.yandex.ru
    img-src:
      - https://mc.yandex.ru
    connect-src:
      - https://mc.yandex.ru
      - wss://mc.yandex.ru
    child-src:
      - 'blob:'
      - https://mc.yandex.ru
    frame-src:
      - 'blob:'
      - https://mc.yandex.ru
    frame-ancestors:
      - 'blob:'
      - https://mc.yandex.ru
canonical: en/concepts/chart/data-export.html
title: Exporting data from charts
description: Follow this guide to export data from charts.
vcsPath: en/concepts/chart/data-export.md
---

# Exporting data from charts

In DataLens, you can export data from charts:

* [Direct export of data](#save-data) displayed on the chart (within [display limits](../limits.md#datalens-chart-data-limits)):

  * Available for all chart types other than maps.

    * With pagination on, only table data from the current page will be exported.
    * For graphs, exports the already aggregated data the chart is built based on.

  * The following formats are available:

    * `XLSX`
    * `CSV`
    * `Markdown` (copied to clipboard)

  * File upload begins immediately.

* [Background data export](#background-export) with extended limits of up to 1 GB:

  * Available only for paginated [Tables](../../visualization-ref/table-chart.md) created in the [wizard](./dataset-based-charts.md). Exports data from all the table's pages.
  * The following formats are available:

    * `XLSX`
    * `CSV`.

  * First, the file is generated in the background, then a download link is created. File preparation takes up to 30 minutes.

Any user with access permissions for a chart can export its data unless you [disable data export](#data-export-disable).

## Direct data export from chart {#save-data}

To export the data displayed on the chart:

1. Open the data export window by doing one of the following:
   
   * Open the chart you want to export data from and click <!-- diplodoc:svg ![image](../../_assets/console-icons/ellipsis.svg) --><svg xmlns="http://www.w3.org/2000/svg" width="16" height="16" fill="none" viewBox="0 0 16 16"><path fill="currentColor" fill-rule="evenodd" d="M3 9.5a1.5 1.5 0 1 0 0-3 1.5 1.5 0 0 0 0 3M9.5 8a1.5 1.5 0 1 1-3 0 1.5 1.5 0 0 1 3 0m5 0a1.5 1.5 0 1 1-3 0 1.5 1.5 0 0 1 3 0" clip-rule="evenodd"/></svg> → <!-- diplodoc:svg ![icon](../../_assets/console-icons/arrow-down-to-line.svg) --><svg xmlns="http://www.w3.org/2000/svg" width="16" height="16" fill="none" viewBox="0 0 16 16"><path fill="currentColor" fill-rule="evenodd" d="M8.53 11.78a.75.75 0 0 1-1.06 0l-2.5-2.5a.75.75 0 0 1 1.06-1.06l1.22 1.22V1.75a.75.75 0 0 1 1.5 0v7.69l1.22-1.22a.75.75 0 1 1 1.06 1.06zM1.75 13.5a.75.75 0 0 0 0 1.5h12.5a.75.75 0 0 0 0-1.5z" clip-rule="evenodd"/></svg> **Save as** in its top-right corner.
   * On the dashboard, find the chart for data export and click <!-- diplodoc:svg ![image](../../_assets/console-icons/ellipsis.svg) --><svg xmlns="http://www.w3.org/2000/svg" width="16" height="16" fill="none" viewBox="0 0 16 16"><path fill="currentColor" fill-rule="evenodd" d="M3 9.5a1.5 1.5 0 1 0 0-3 1.5 1.5 0 0 0 0 3M9.5 8a1.5 1.5 0 1 1-3 0 1.5 1.5 0 0 1 3 0m5 0a1.5 1.5 0 1 1-3 0 1.5 1.5 0 0 1 3 0" clip-rule="evenodd"/></svg> → <!-- diplodoc:svg ![icon](../../_assets/console-icons/arrow-down-to-line.svg) --><svg xmlns="http://www.w3.org/2000/svg" width="16" height="16" fill="none" viewBox="0 0 16 16"><path fill="currentColor" fill-rule="evenodd" d="M8.53 11.78a.75.75 0 0 1-1.06 0l-2.5-2.5a.75.75 0 0 1 1.06-1.06l1.22 1.22V1.75a.75.75 0 0 1 1.5 0v7.69l1.22-1.22a.75.75 0 1 1 1.06 1.06zM1.75 13.5a.75.75 0 0 0 0 1.5h12.5a.75.75 0 0 0 0-1.5z" clip-rule="evenodd"/></svg> **Save as** in its top-right corner.

1. Select the format and download settings, then click **Save**.

   {% note info %}

   If you see two tabs named **Current page** and **All pages** in the window that opens when you select the `CSV` format, remain on the **Current page** tab. The **All pages** tab is reserved for [background export](#background-export).
  
   {% endnote %}

The data file will be generated immediately and downloaded in your browser. The maximum export file size is 50 MB.

## Background data export {#background-export}

* [Limitations](#restrictions)
* [Exporting data in background](#how-to-background-export)
* [Export page](#export-page)
* [Export history](#data-export-history)

Before initiating a background data export, make sure that:

* Export is not [disabled](#data-export-disable) at the DataLens instance level or  connection or dataset level.

### Limits {#restrictions}

The following limitations apply to the background export:

* Not supported for [QL charts](./ql-charts.md) or charts created in [Editor](../../charts/editor/index.md).
* Not available in [pivot tables](../../visualization-ref/pivot-table-chart.md).
* Table [pagination](./settings.md#common-settings) must be enabled.
* Minimum number of pages to export is two.
* Maximum number of rows in the table is 1,000,000.
* [Rows with totals](../../visualization-ref/table-chart.md#add-totals) and [tree hierarchy](../../dataset/data-types.md#how-to-create-tree) are not supported. You can export a tree hierarchy if pagination is disabled.


* Maximum export file size is 1 GB.
* File is available for download for 24 hours after the export is complete.

### Exporting data in background {#how-to-background-export}

To initiate a background export, do the following:

1. Open the data export window by doing one of the following:

   * Open the chart you want to export data from and click <!-- diplodoc:svg ![image](../../_assets/console-icons/ellipsis.svg) --><svg xmlns="http://www.w3.org/2000/svg" width="16" height="16" fill="none" viewBox="0 0 16 16"><path fill="currentColor" fill-rule="evenodd" d="M3 9.5a1.5 1.5 0 1 0 0-3 1.5 1.5 0 0 0 0 3M9.5 8a1.5 1.5 0 1 1-3 0 1.5 1.5 0 0 1 3 0m5 0a1.5 1.5 0 1 1-3 0 1.5 1.5 0 0 1 3 0" clip-rule="evenodd"/></svg> → <!-- diplodoc:svg ![icon](../../_assets/console-icons/arrow-down-to-line.svg) --><svg xmlns="http://www.w3.org/2000/svg" width="16" height="16" fill="none" viewBox="0 0 16 16"><path fill="currentColor" fill-rule="evenodd" d="M8.53 11.78a.75.75 0 0 1-1.06 0l-2.5-2.5a.75.75 0 0 1 1.06-1.06l1.22 1.22V1.75a.75.75 0 0 1 1.5 0v7.69l1.22-1.22a.75.75 0 1 1 1.06 1.06zM1.75 13.5a.75.75 0 0 0 0 1.5h12.5a.75.75 0 0 0 0-1.5z" clip-rule="evenodd"/></svg> **Save as** → **CSV** or **XLSX** in its top-right corner.
   * On the dashboard, find the chart for data export and click <!-- diplodoc:svg ![image](../../_assets/console-icons/ellipsis.svg) --><svg xmlns="http://www.w3.org/2000/svg" width="16" height="16" fill="none" viewBox="0 0 16 16"><path fill="currentColor" fill-rule="evenodd" d="M3 9.5a1.5 1.5 0 1 0 0-3 1.5 1.5 0 0 0 0 3M9.5 8a1.5 1.5 0 1 1-3 0 1.5 1.5 0 0 1 3 0m5 0a1.5 1.5 0 1 1-3 0 1.5 1.5 0 0 1 3 0" clip-rule="evenodd"/></svg> → <!-- diplodoc:svg ![icon](../../_assets/console-icons/arrow-down-to-line.svg) --><svg xmlns="http://www.w3.org/2000/svg" width="16" height="16" fill="none" viewBox="0 0 16 16"><path fill="currentColor" fill-rule="evenodd" d="M8.53 11.78a.75.75 0 0 1-1.06 0l-2.5-2.5a.75.75 0 0 1 1.06-1.06l1.22 1.22V1.75a.75.75 0 0 1 1.5 0v7.69l1.22-1.22a.75.75 0 1 1 1.06 1.06zM1.75 13.5a.75.75 0 0 0 0 1.5h12.5a.75.75 0 0 0 0-1.5z" clip-rule="evenodd"/></svg> **Save as** → **CSV** or **XLSX** in its top-right corner.

1. In the export window, under **Pages**, select `All`. Optionally, edit the following export file settings: **Value delimiter**, **Decimal separator**, and **Encoding**. You can also navigate to the list of exported data by clicking **Export history**.
1. Click **Save**. At the bottom of your screen, you will see a message saying that the export has started and a link to the [export page](#export-page), where you can monitor the export status and details. Once the export is complete, you will get the **Chart export complete** message with links to the export page and file for download.
  
  If the export fails, you will get an error message. Make sure that data export is not [disabled](#data-export-disable) for this chart at any level and the user has the required permissions, then try again.

The user who initiated the export can download the export file from the [data export history](#data-export-history) page. 

### Export page {#export-page}

The export page displays the following information:

* Export status or errors.
* Chart with exported data.
* Dataset used to create the chart.
* Connection used to create the chart.
* Workbook containing the chart.
* Export start time and duration.
* User who initiated the export and the **Copy user ID** button.
* **Download** button to download the file with data. This button will be available after the export is complete to the user who started the export for 24 hours only.

### Background data export history {#data-export-history}

You can open the history window for background data export in one of the following ways:

* In the left-hand panel, select <!-- diplodoc:svg ![sliders](../../_assets/console-icons/arrow-up-from-square.svg) --><svg xmlns="http://www.w3.org/2000/svg" width="16" height="16" fill="none" viewBox="0 0 16 16"><path fill="currentColor" fill-rule="evenodd" d="M7.47 1.22a.75.75 0 0 1 1.06 0l2.5 2.5a.75.75 0 1 1-1.06 1.06L8.75 3.56v7.69a.75.75 0 0 1-1.5 0V3.56L6.03 4.78a.75.75 0 0 1-1.06-1.06zM4.25 6.5a.75.75 0 0 1 0 1.5H4a1.5 1.5 0 0 0-1.5 1.5V12A1.5 1.5 0 0 0 4 13.5h8a1.5 1.5 0 0 0 1.5-1.5V9.5A1.5 1.5 0 0 0 12 8h-.25a.75.75 0 0 1 0-1.5H12a3 3 0 0 1 3 3V12a3 3 0 0 1-3 3H4a3 3 0 0 1-3-3V9.5a3 3 0 0 1 3-3z" clip-rule="evenodd"/></svg> **Background data export**.
* In the left-hand panel, select <!-- diplodoc:svg ![sliders](../../_assets/console-icons/sliders.svg) --><svg xmlns="http://www.w3.org/2000/svg" width="16" height="16" fill="none" viewBox="0 0 16 16"><path fill="currentColor" fill-rule="evenodd" d="M7.5 5a1.5 1.5 0 1 1-3 0 1.5 1.5 0 0 1 3 0m1.405.75a3.001 3.001 0 0 1-5.81 0H1.747a.75.75 0 0 1 0-1.5h1.348a3.001 3.001 0 0 1 5.81 0h5.345a.75.75 0 0 1 0 1.5zm-7.158 4.5h5.345a3.001 3.001 0 0 1 5.811 0h1.347a.75.75 0 1 1 0 1.5h-1.347a3.001 3.001 0 0 1-5.81 0H1.746a.75.75 0 0 1 0-1.5m8.25-.75a1.5 1.5 0 1 0 0 3 1.5 1.5 0 0 0 0-3" clip-rule="evenodd"/></svg> **Service settings** and on the **General** tab, click **Background data export** under **Data export**.
* Open the [chart export](#how-to-background-export) window and click **Export history**.
* After your export completes, follow the **Export page** link in the **Chart export complete** notification.

Export data is loading up as you scroll the page.
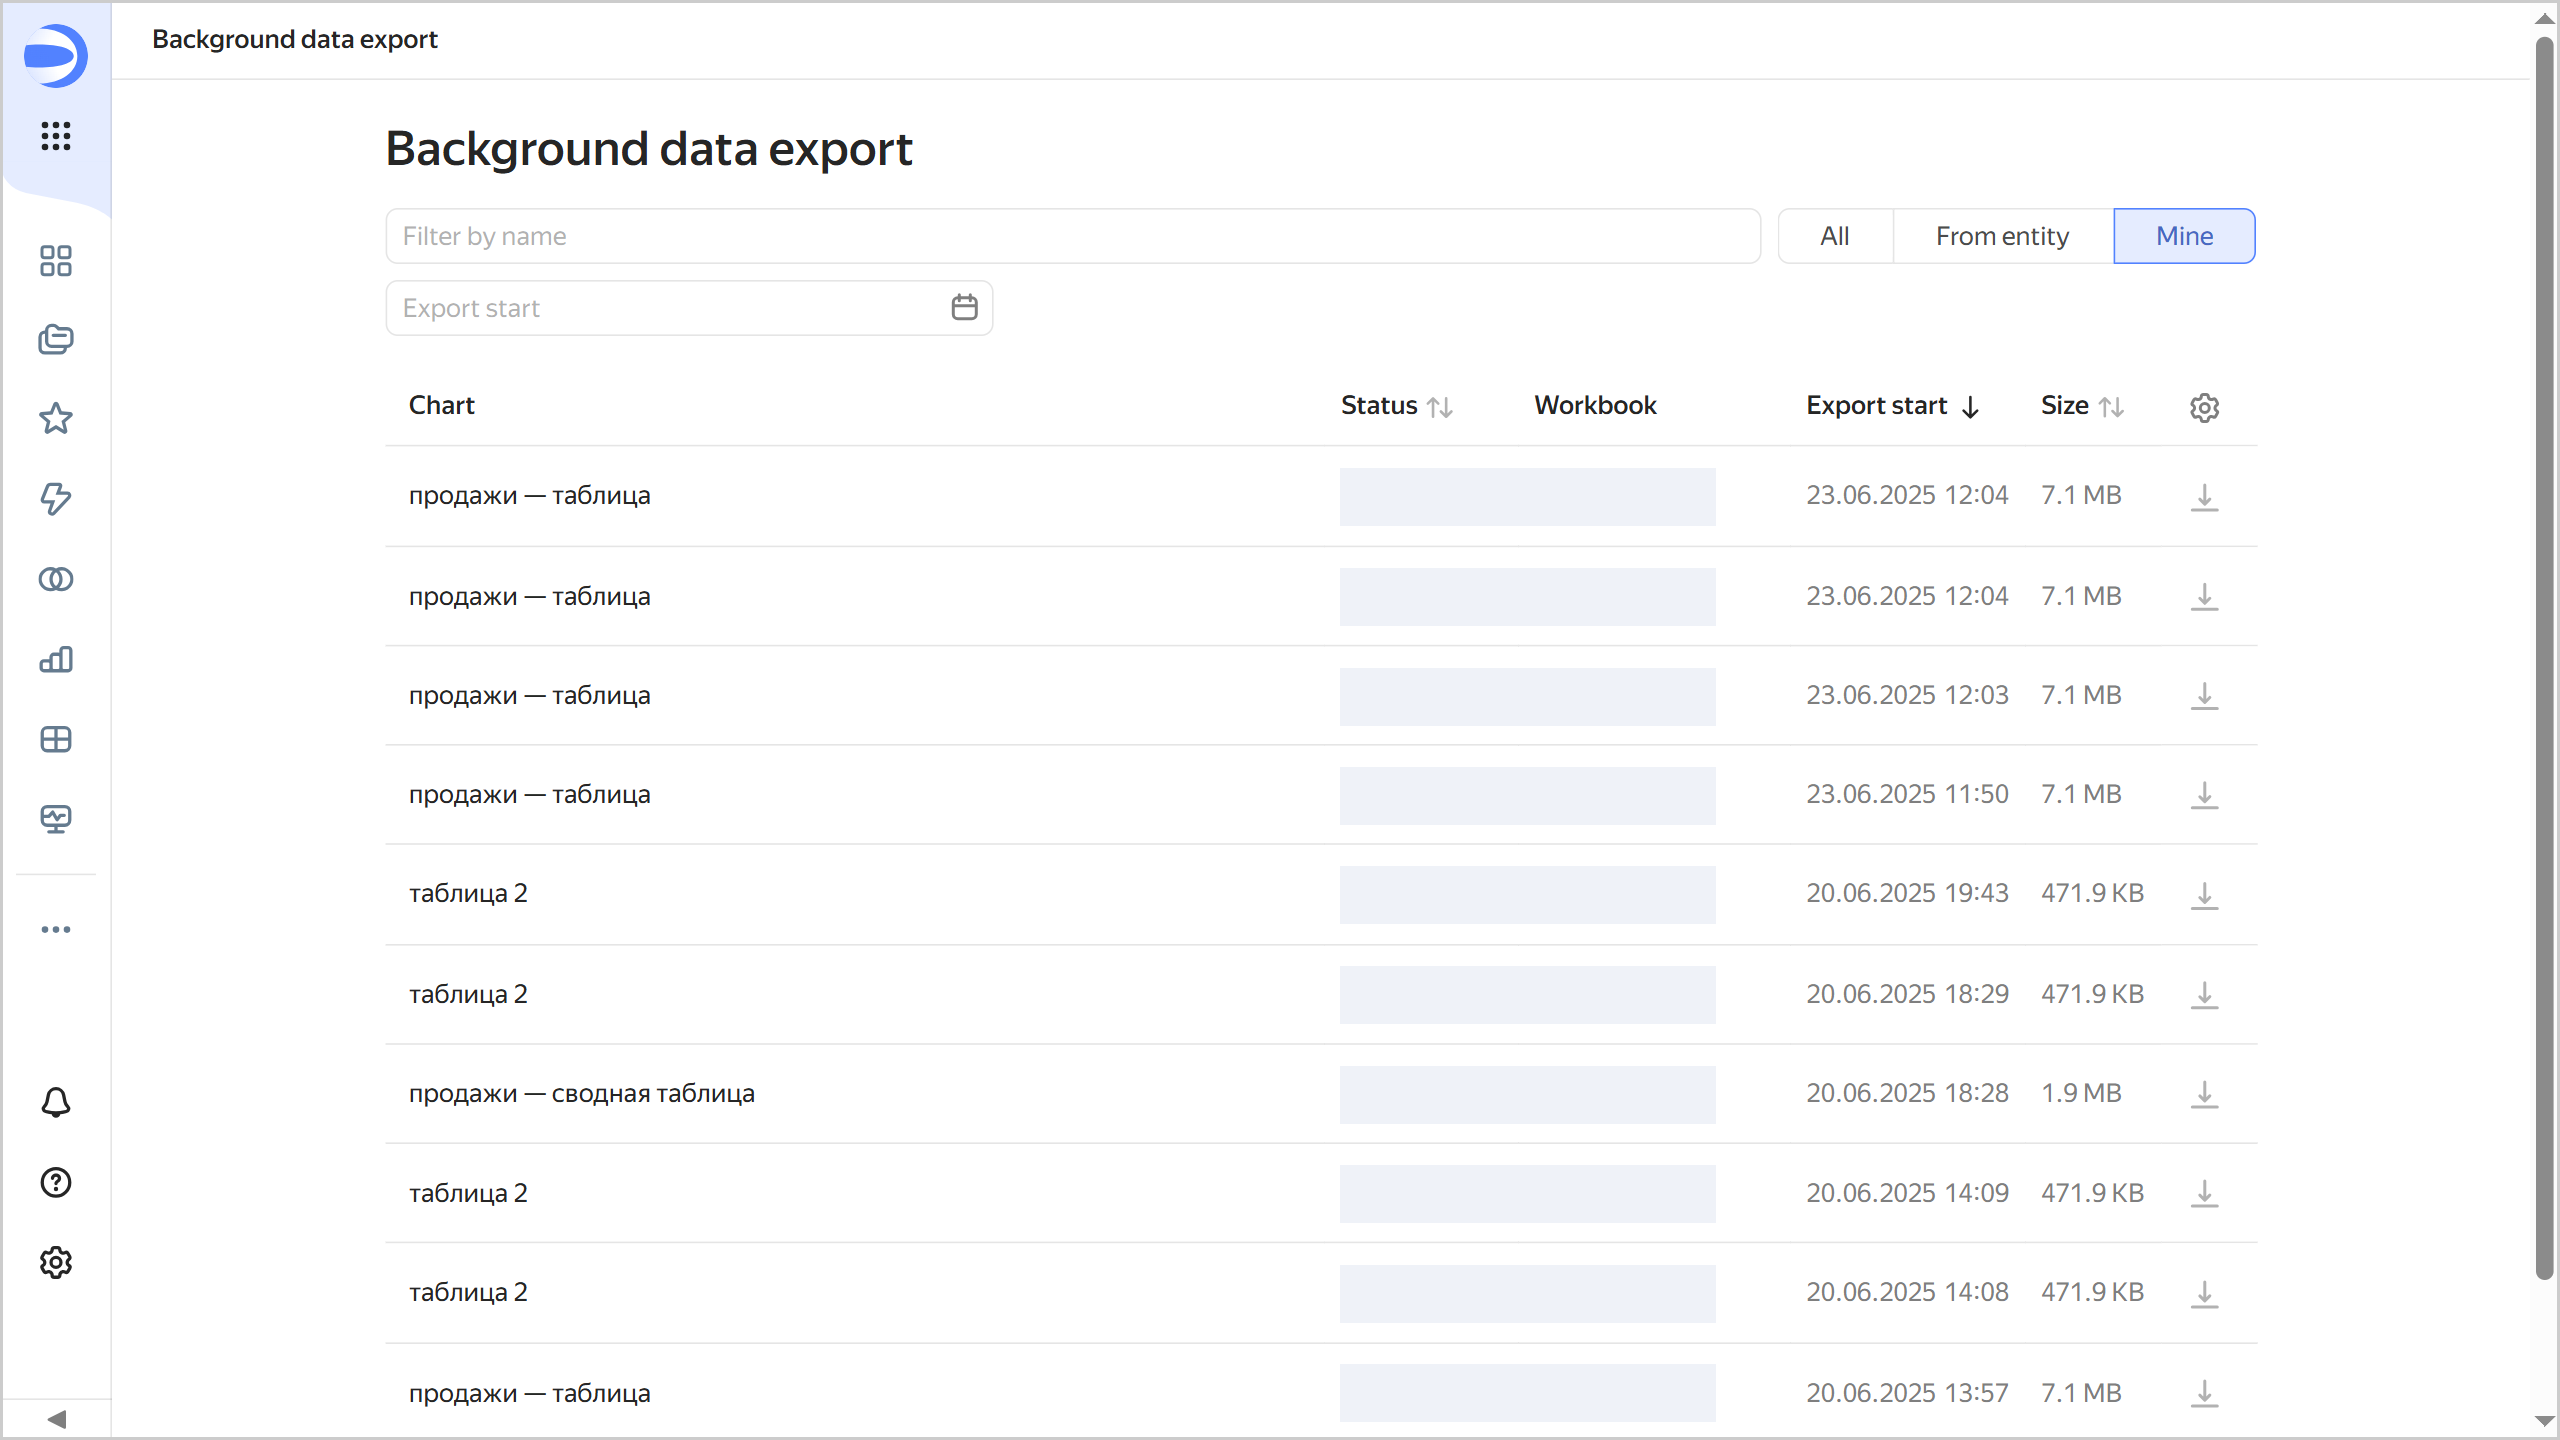
![image](../../_assets/datalens/chart/data-export-history.png)

The page displays a list of export operations and their details:

* Chart with exported data.
* Export status.
* Workbook containing the chart.
* User who initiated the export.
* Export start date and time.
* Exported file size.

To download the file, click <!-- diplodoc:svg ![icon](../../_assets/console-icons/arrow-down-to-line.svg) --><svg xmlns="http://www.w3.org/2000/svg" width="16" height="16" fill="none" viewBox="0 0 16 16"><path fill="currentColor" fill-rule="evenodd" d="M8.53 11.78a.75.75 0 0 1-1.06 0l-2.5-2.5a.75.75 0 0 1 1.06-1.06l1.22 1.22V1.75a.75.75 0 0 1 1.5 0v7.69l1.22-1.22a.75.75 0 1 1 1.06 1.06zM1.75 13.5a.75.75 0 0 0 0 1.5h12.5a.75.75 0 0 0 0-1.5z" clip-rule="evenodd"/></svg> in the export row. To select which columns to display in the list, click <!-- diplodoc:svg ![icon](../../_assets/console-icons/gear.svg) --><svg xmlns="http://www.w3.org/2000/svg" width="16" height="16" fill="none" viewBox="0 0 16 16"><path fill="currentColor" fill-rule="evenodd" d="M7.199 2H8.8a.2.2 0 0 1 .2.2c0 1.808 1.958 2.939 3.524 2.034a.2.2 0 0 1 .271.073l.802 1.388a.2.2 0 0 1-.073.272c-1.566.904-1.566 3.164 0 4.069a.2.2 0 0 1 .073.271l-.802 1.388a.2.2 0 0 1-.271.073C10.958 10.863 9 11.993 9 13.8a.2.2 0 0 1-.199.2H7.2a.2.2 0 0 1-.2-.2c0-1.808-1.958-2.938-3.524-2.034a.2.2 0 0 1-.272-.073l-.8-1.388a.2.2 0 0 1 .072-.271c1.566-.905 1.566-3.165 0-4.07a.2.2 0 0 1-.073-.27l.801-1.389a.2.2 0 0 1 .272-.072C5.042 5.138 7 4.007 7 2.199c0-.11.089-.199.199-.199M5.5 2.2c0-.94.76-1.7 1.699-1.7H8.8c.94 0 1.7.76 1.7 1.7a.85.85 0 0 0 1.274.735 1.7 1.7 0 0 1 2.32.622l.802 1.388c.469.813.19 1.851-.622 2.32a.85.85 0 0 0 0 1.472 1.7 1.7 0 0 1 .622 2.32l-.802 1.388a1.7 1.7 0 0 1-2.32.622.85.85 0 0 0-1.274.735c0 .939-.76 1.7-1.699 1.7H7.2a1.7 1.7 0 0 1-1.699-1.7.85.85 0 0 0-1.274-.735 1.7 1.7 0 0 1-2.32-.622l-.802-1.388a1.7 1.7 0 0 1 .622-2.32.85.85 0 0 0 0-1.471 1.7 1.7 0 0 1-.622-2.32l.801-1.389a1.7 1.7 0 0 1 2.32-.622A.85.85 0 0 0 5.5 2.2m4 5.8a1.5 1.5 0 1 1-3 0 1.5 1.5 0 0 1 3 0M11 8a3 3 0 1 1-6 0 3 3 0 0 1 6 0" clip-rule="evenodd"/></svg>.

To narrow down the list of exports, you can filter them by:

* Selected object.
* Source chart name.
* Export start date.


Users with the `datalens.admin` role in the organization can also select to display `All` exports. This allows them to view all exports created within the organization and filter them by export initiator.


## Disabling data export {#data-export-disable}

By default, users can export data from charts. You can disable this option at the DataLens instance level or connection or dataset level.

{% list tabs %}


- Instance level

  To disable data export, you need the `Admin` (`datalens.admin`) role.
  
  1. In the left-hand panel, select <!-- diplodoc:svg ![sliders](../../_assets/console-icons/sliders.svg) --><svg xmlns="http://www.w3.org/2000/svg" width="16" height="16" fill="none" viewBox="0 0 16 16"><path fill="currentColor" fill-rule="evenodd" d="M7.5 5a1.5 1.5 0 1 1-3 0 1.5 1.5 0 0 1 3 0m1.405.75a3.001 3.001 0 0 1-5.81 0H1.747a.75.75 0 0 1 0-1.5h1.348a3.001 3.001 0 0 1 5.81 0h5.345a.75.75 0 0 1 0 1.5zm-7.158 4.5h5.345a3.001 3.001 0 0 1 5.811 0h1.347a.75.75 0 1 1 0 1.5h-1.347a3.001 3.001 0 0 1-5.81 0H1.746a.75.75 0 0 1 0-1.5m8.25-.75a1.5 1.5 0 1 0 0 3 1.5 1.5 0 0 0 0-3" clip-rule="evenodd"/></svg> **Service settings**.

  
  1. On the **General** tab, disable the **Data export** option (on by default).
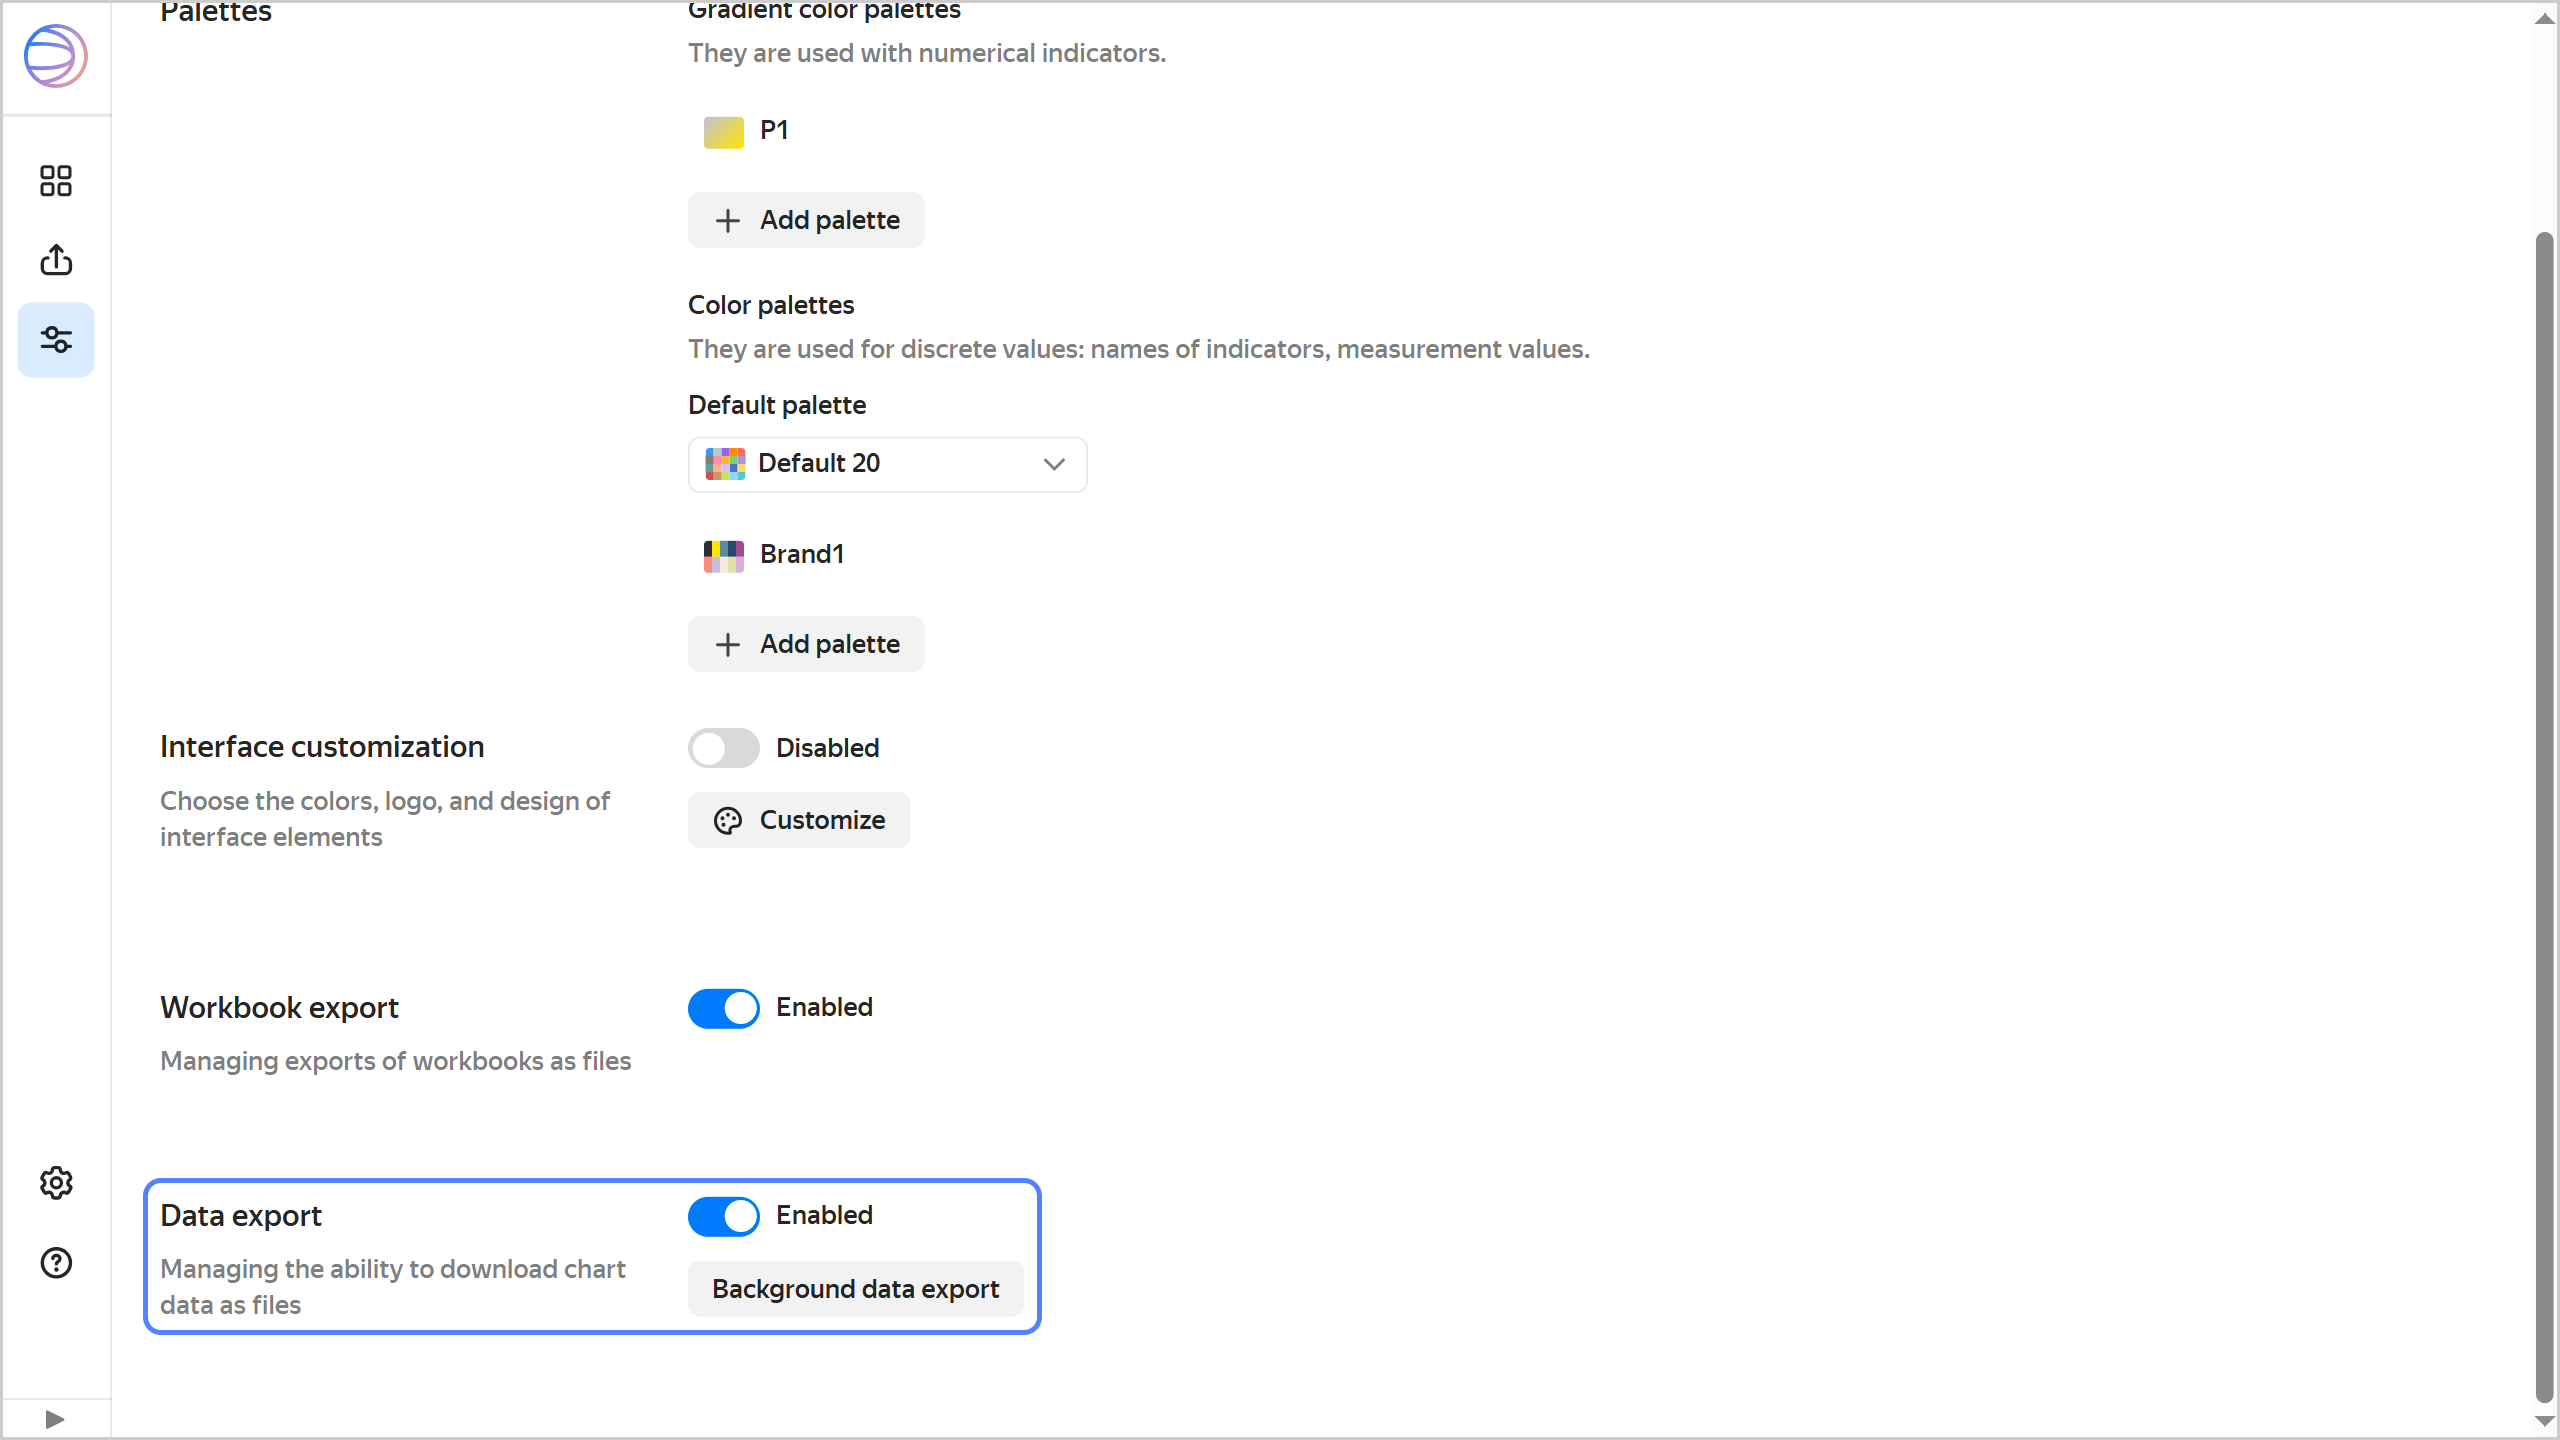
     ![image](../../_assets/datalens/settings/data-export-disable-ent.png)

  
  After you prohibit export:
  
  * In the chart interface, the export option will be removed from the <!-- diplodoc:svg ![icon](../../_assets/console-icons/ellipsis.svg) --><svg xmlns="http://www.w3.org/2000/svg" width="16" height="16" fill="none" viewBox="0 0 16 16"><path fill="currentColor" fill-rule="evenodd" d="M3 9.5a1.5 1.5 0 1 0 0-3 1.5 1.5 0 0 0 0 3M9.5 8a1.5 1.5 0 1 1-3 0 1.5 1.5 0 0 1 3 0m5 0a1.5 1.5 0 1 1-3 0 1.5 1.5 0 0 1 3 0" clip-rule="evenodd"/></svg> menu, and users will be unable to export chart data.
  * However, they will still be able to copy data from the charts and take screenshots.


- Connection level

  To disable data export, you need the [Editor](../../security/roles.md#datalensworkbookseditor-datalens-workbooks-editor) (`datalens.workbooks.editor`) role for the workbook with the connection.

  1. Go to the connection page.
  1. Under **Advanced connection settings**, activate the **Disable data export** option.
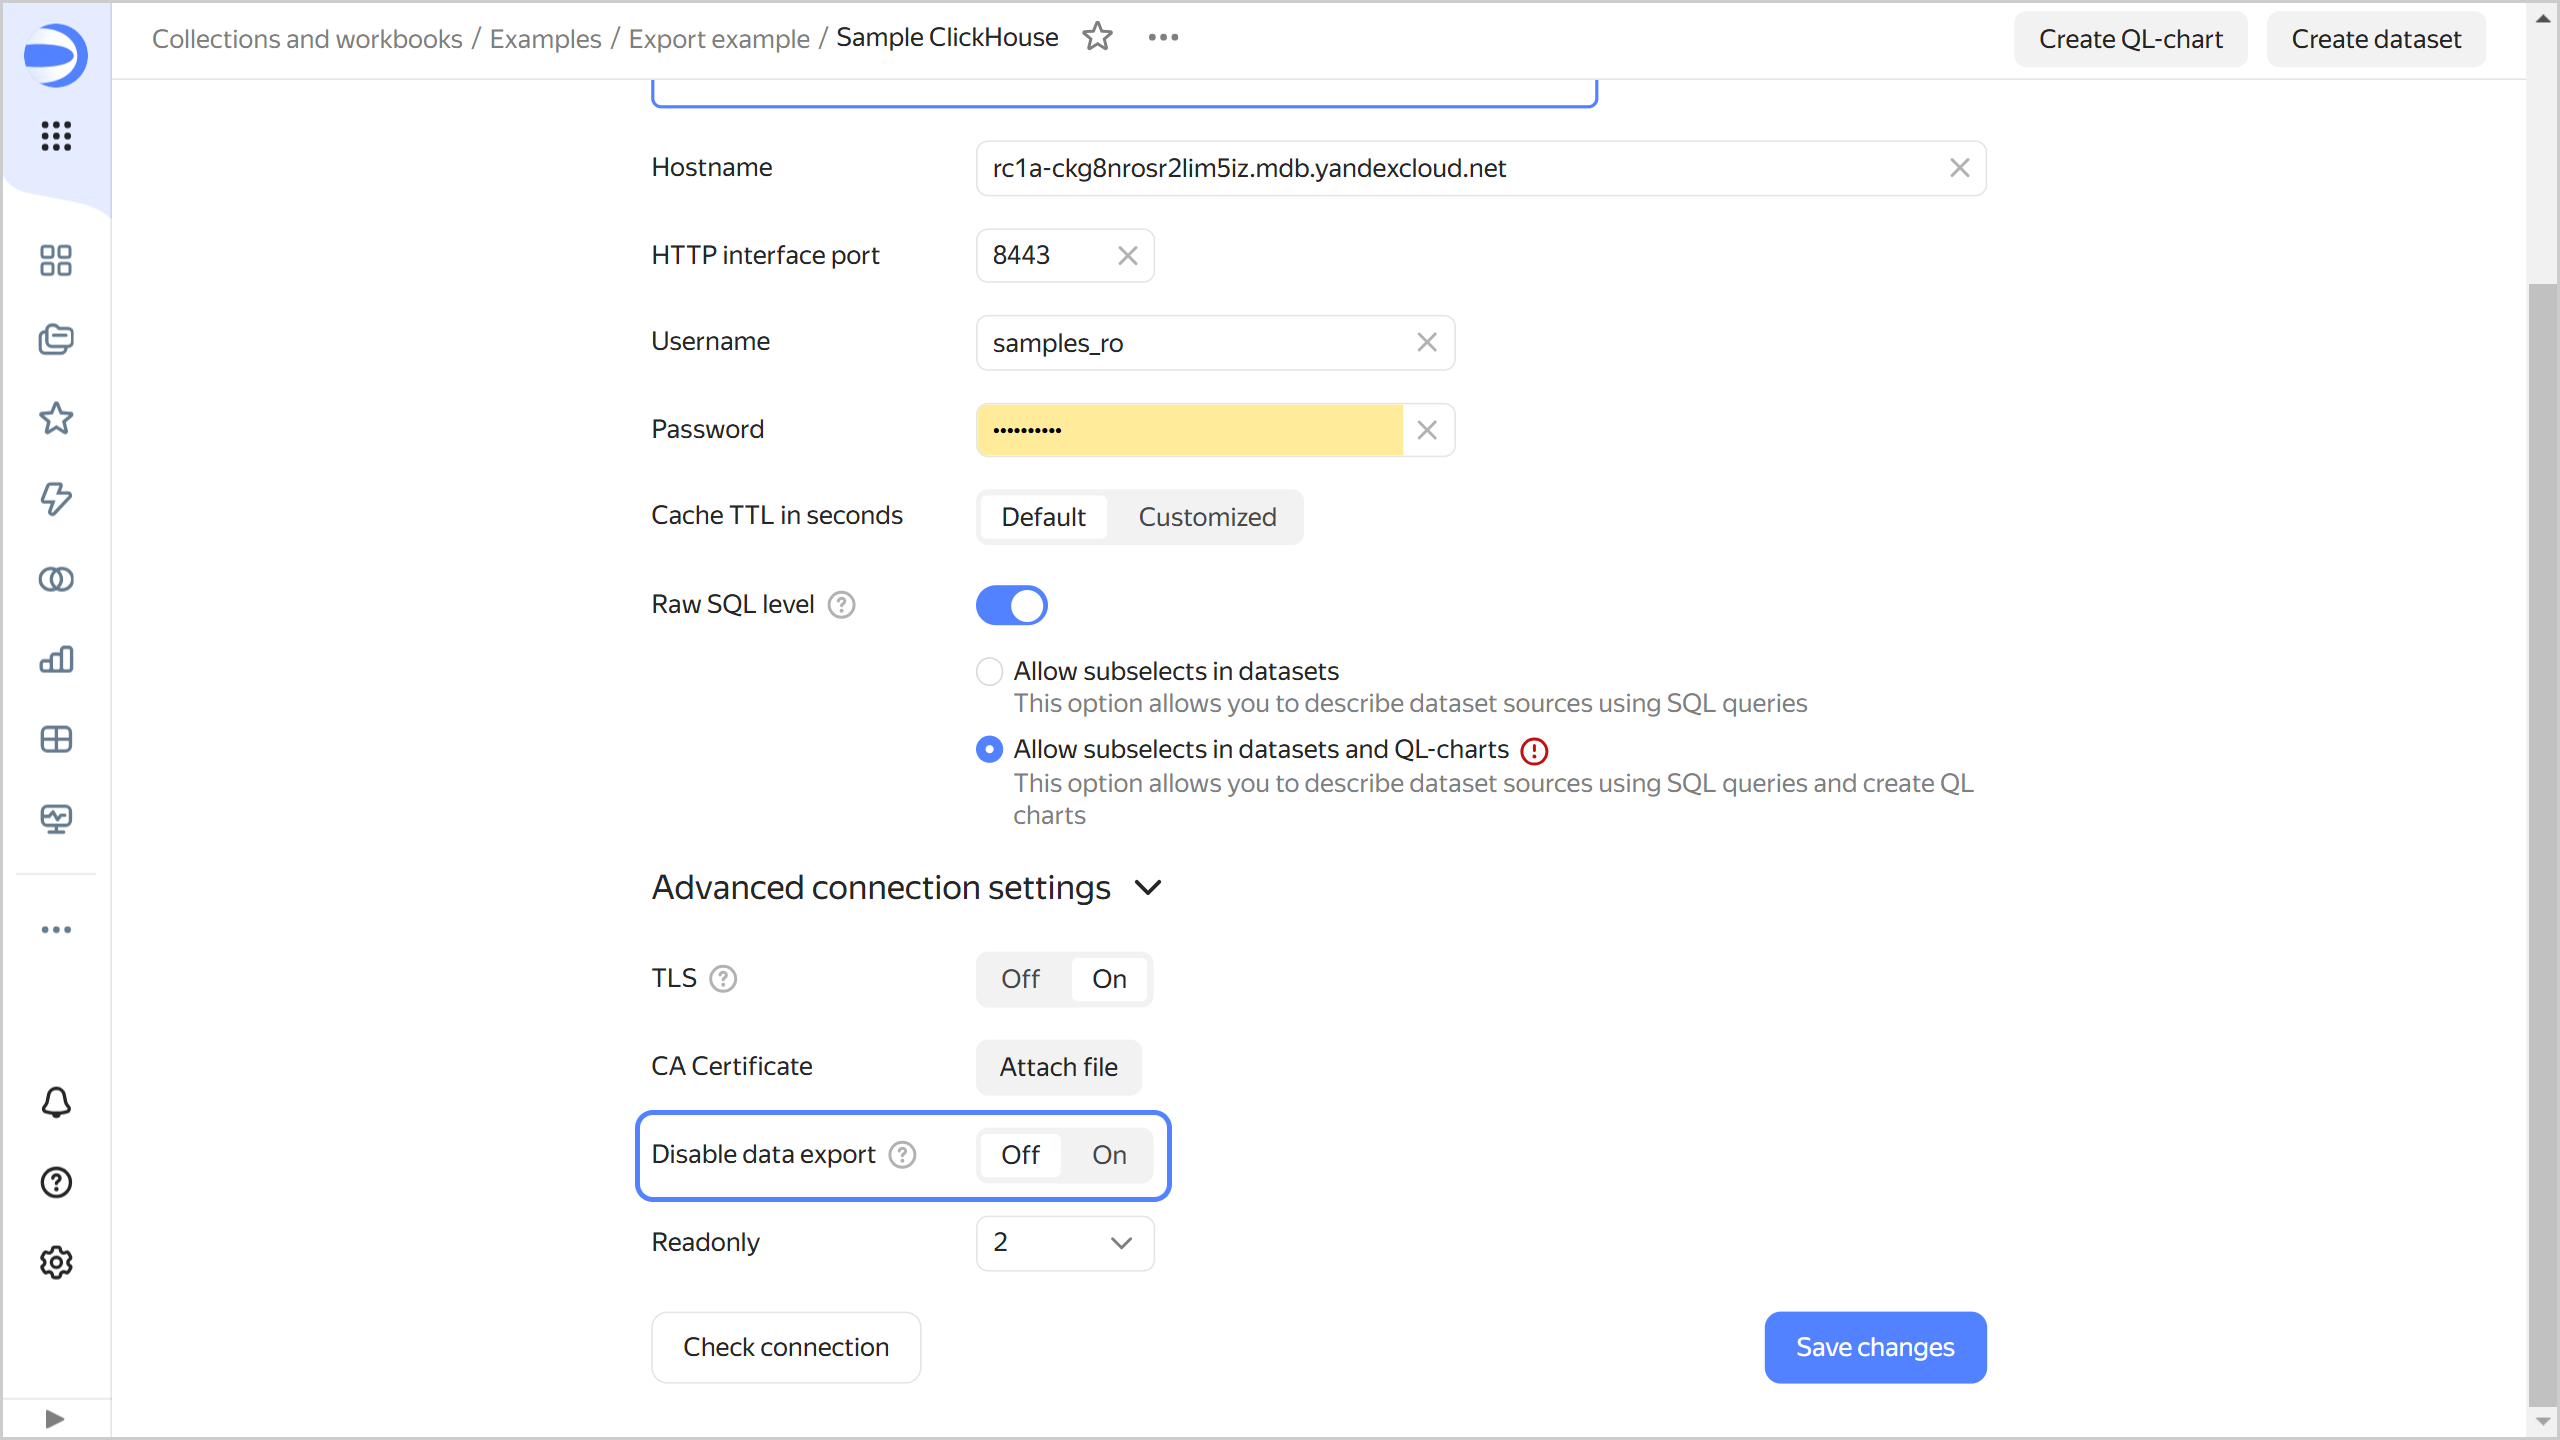
     ![image](../../_assets/datalens/chart/connection-export-disable.png)

     For connections to [Files](../../operations/connection/create-file.md), click <!-- diplodoc:svg ![icon](../../_assets/console-icons/gear.svg) --><svg xmlns="http://www.w3.org/2000/svg" width="16" height="16" fill="none" viewBox="0 0 16 16"><path fill="currentColor" fill-rule="evenodd" d="M7.199 2H8.8a.2.2 0 0 1 .2.2c0 1.808 1.958 2.939 3.524 2.034a.2.2 0 0 1 .271.073l.802 1.388a.2.2 0 0 1-.073.272c-1.566.904-1.566 3.164 0 4.069a.2.2 0 0 1 .073.271l-.802 1.388a.2.2 0 0 1-.271.073C10.958 10.863 9 11.993 9 13.8a.2.2 0 0 1-.199.2H7.2a.2.2 0 0 1-.2-.2c0-1.808-1.958-2.938-3.524-2.034a.2.2 0 0 1-.272-.073l-.8-1.388a.2.2 0 0 1 .072-.271c1.566-.905 1.566-3.165 0-4.07a.2.2 0 0 1-.073-.27l.801-1.389a.2.2 0 0 1 .272-.072C5.042 5.138 7 4.007 7 2.199c0-.11.089-.199.199-.199M5.5 2.2c0-.94.76-1.7 1.699-1.7H8.8c.94 0 1.7.76 1.7 1.7a.85.85 0 0 0 1.274.735 1.7 1.7 0 0 1 2.32.622l.802 1.388c.469.813.19 1.851-.622 2.32a.85.85 0 0 0 0 1.472 1.7 1.7 0 0 1 .622 2.32l-.802 1.388a1.7 1.7 0 0 1-2.32.622.85.85 0 0 0-1.274.735c0 .939-.76 1.7-1.699 1.7H7.2a1.7 1.7 0 0 1-1.699-1.7.85.85 0 0 0-1.274-.735 1.7 1.7 0 0 1-2.32-.622l-.802-1.388a1.7 1.7 0 0 1 .622-2.32.85.85 0 0 0 0-1.471 1.7 1.7 0 0 1-.622-2.32l.801-1.389a1.7 1.7 0 0 1 2.32-.622A.85.85 0 0 0 5.5 2.2m4 5.8a1.5 1.5 0 1 1-3 0 1.5 1.5 0 0 1 3 0M11 8a3 3 0 1 1-6 0 3 3 0 0 1 6 0" clip-rule="evenodd"/></svg> at the top right and uncheck **Allow data export**.
  After you prohibit export:
  
  * Charts based on this connection will no longer display the export option in their <!-- diplodoc:svg ![icon](../../_assets/console-icons/ellipsis.svg) --><svg xmlns="http://www.w3.org/2000/svg" width="16" height="16" fill="none" viewBox="0 0 16 16"><path fill="currentColor" fill-rule="evenodd" d="M3 9.5a1.5 1.5 0 1 0 0-3 1.5 1.5 0 0 0 0 3M9.5 8a1.5 1.5 0 1 1-3 0 1.5 1.5 0 0 1 3 0m5 0a1.5 1.5 0 1 1-3 0 1.5 1.5 0 0 1 3 0" clip-rule="evenodd"/></svg> menu, and users will be unable to export data from those charts.
  * However, users can still manually copy data from charts or take screenshots.

- Dataset level
 
  To disable data export, you need the [Editor](../../security/roles.md#datalensworkbookseditor-datalens-workbooks-editor) (`datalens.workbooks.editor`) role for the workbook with the dataset.
  
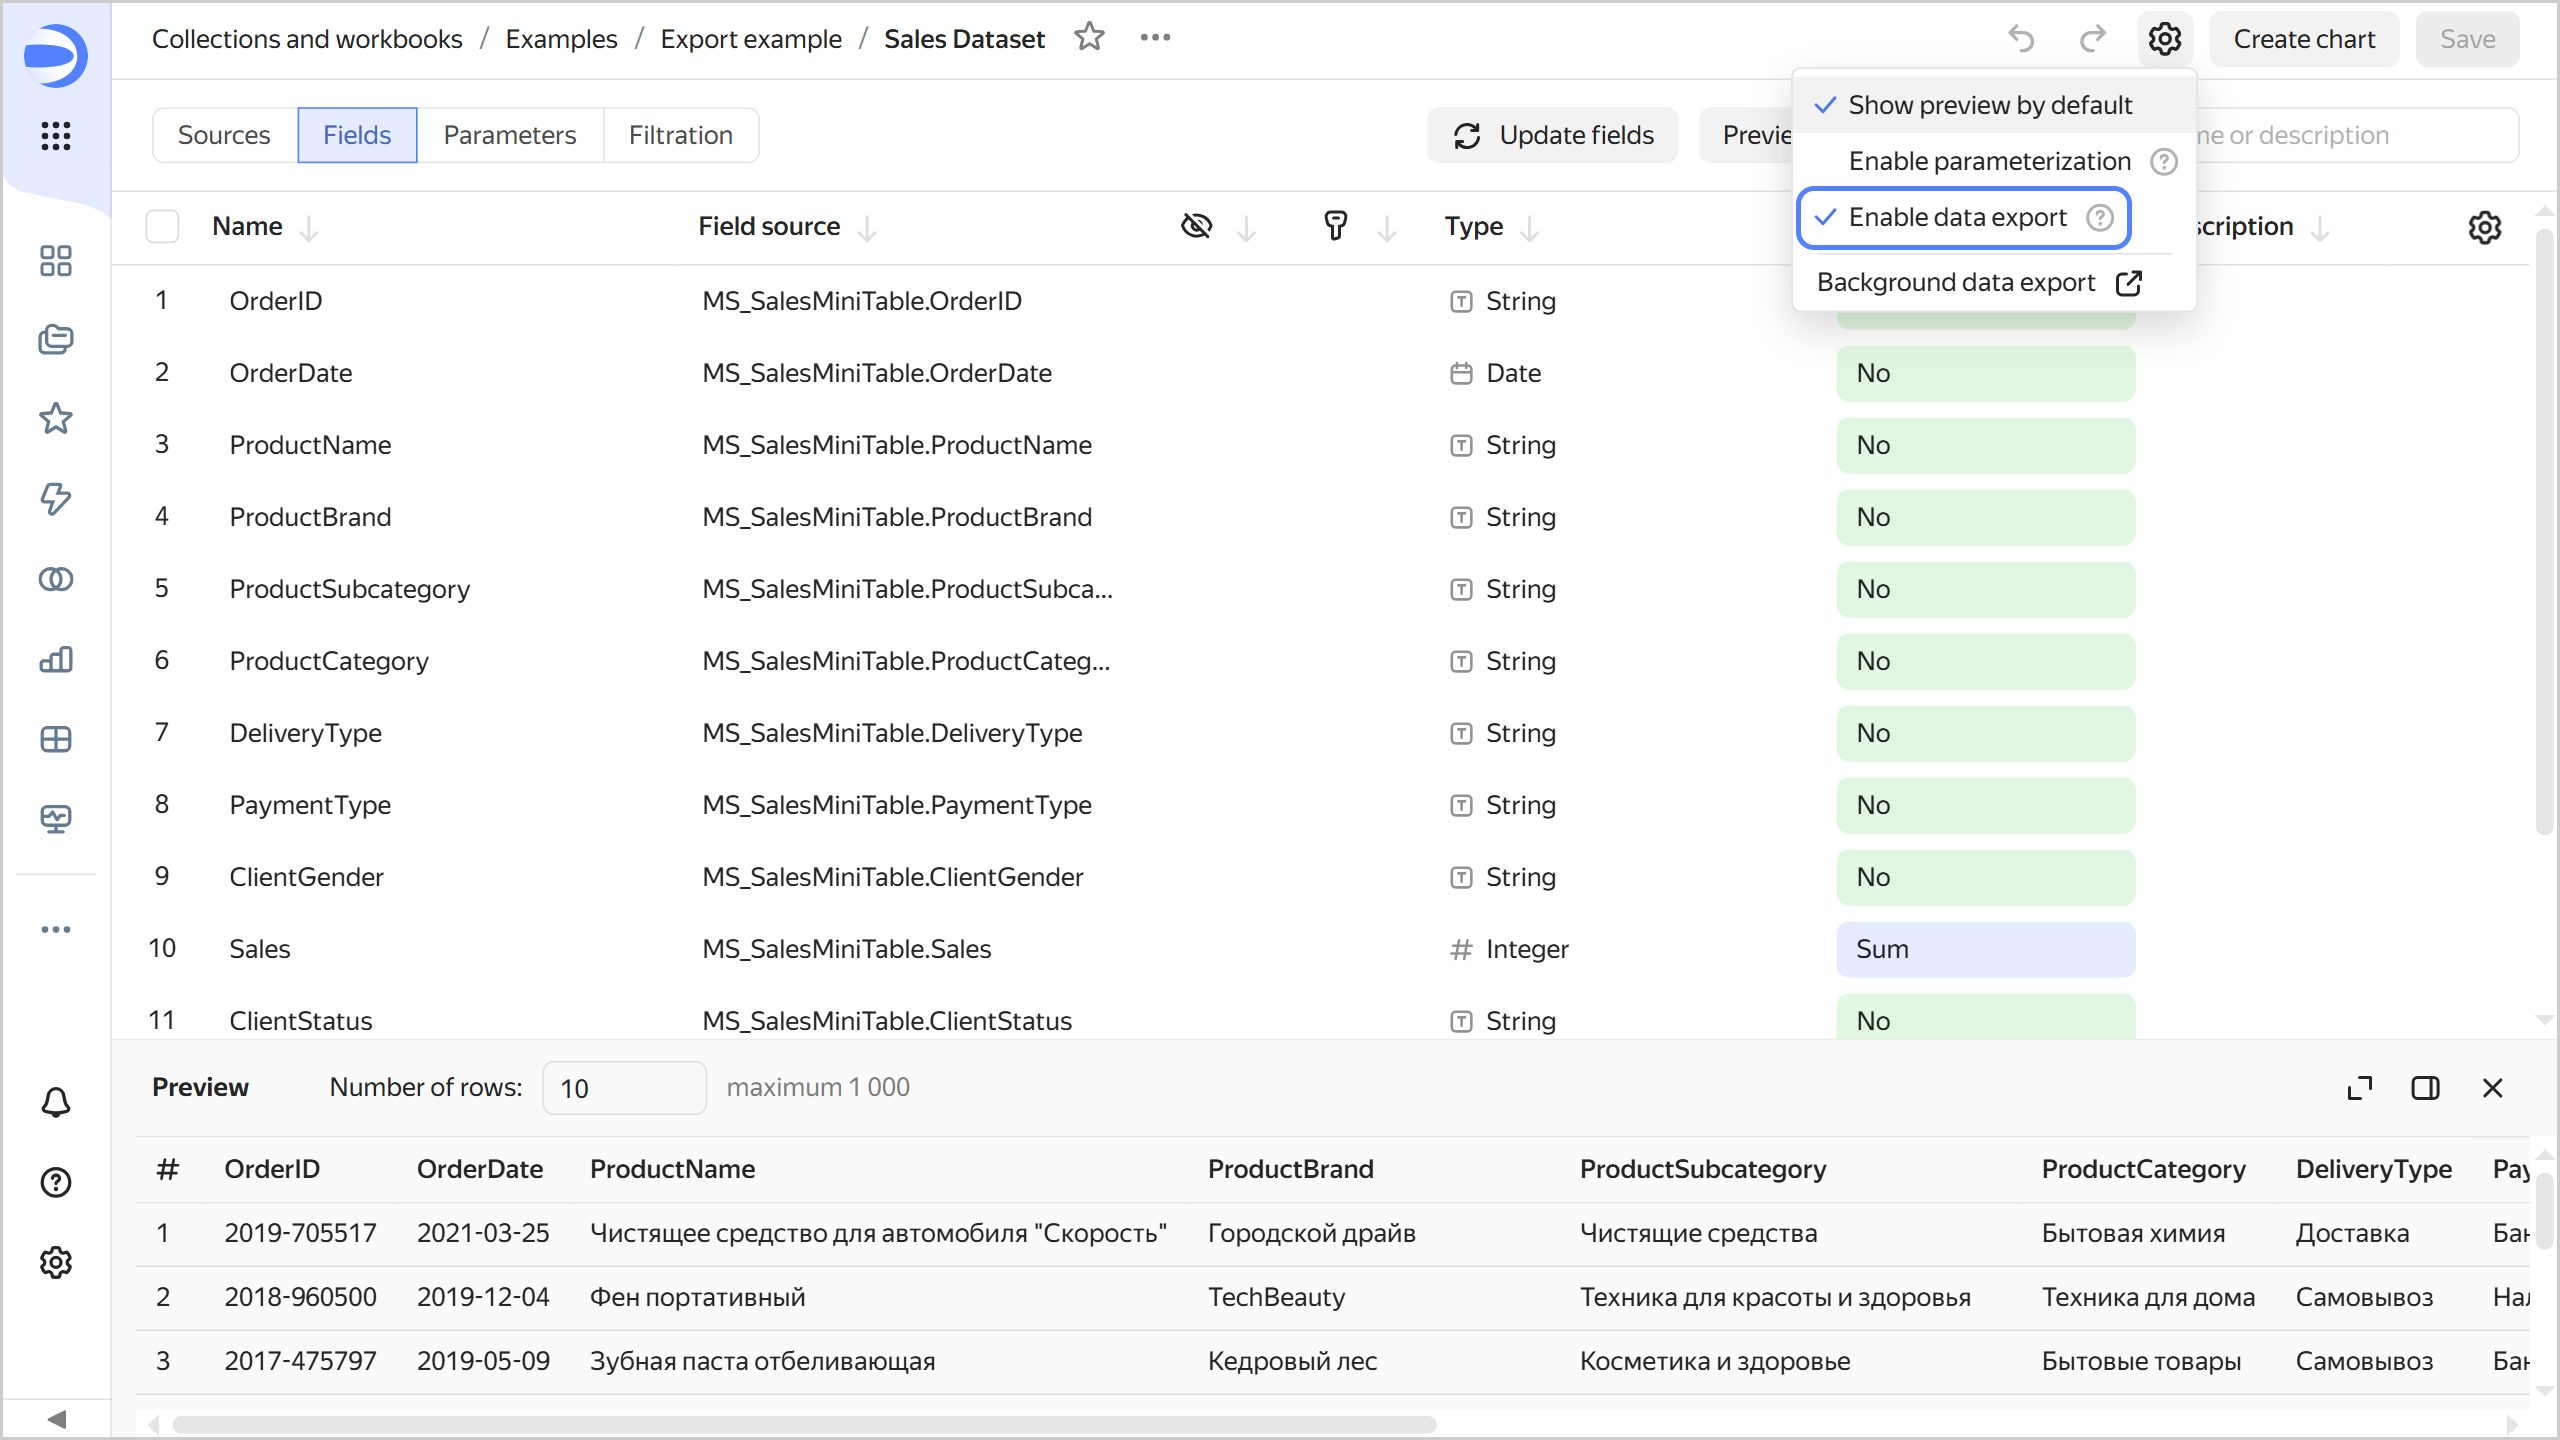
  1. Go to the dataset page.
  1. Click <!-- diplodoc:svg ![icon](../../_assets/console-icons/gear.svg) --><svg xmlns="http://www.w3.org/2000/svg" width="16" height="16" fill="none" viewBox="0 0 16 16"><path fill="currentColor" fill-rule="evenodd" d="M7.199 2H8.8a.2.2 0 0 1 .2.2c0 1.808 1.958 2.939 3.524 2.034a.2.2 0 0 1 .271.073l.802 1.388a.2.2 0 0 1-.073.272c-1.566.904-1.566 3.164 0 4.069a.2.2 0 0 1 .073.271l-.802 1.388a.2.2 0 0 1-.271.073C10.958 10.863 9 11.993 9 13.8a.2.2 0 0 1-.199.2H7.2a.2.2 0 0 1-.2-.2c0-1.808-1.958-2.938-3.524-2.034a.2.2 0 0 1-.272-.073l-.8-1.388a.2.2 0 0 1 .072-.271c1.566-.905 1.566-3.165 0-4.07a.2.2 0 0 1-.073-.27l.801-1.389a.2.2 0 0 1 .272-.072C5.042 5.138 7 4.007 7 2.199c0-.11.089-.199.199-.199M5.5 2.2c0-.94.76-1.7 1.699-1.7H8.8c.94 0 1.7.76 1.7 1.7a.85.85 0 0 0 1.274.735 1.7 1.7 0 0 1 2.32.622l.802 1.388c.469.813.19 1.851-.622 2.32a.85.85 0 0 0 0 1.472 1.7 1.7 0 0 1 .622 2.32l-.802 1.388a1.7 1.7 0 0 1-2.32.622.85.85 0 0 0-1.274.735c0 .939-.76 1.7-1.699 1.7H7.2a1.7 1.7 0 0 1-1.699-1.7.85.85 0 0 0-1.274-.735 1.7 1.7 0 0 1-2.32-.622l-.802-1.388a1.7 1.7 0 0 1 .622-2.32.85.85 0 0 0 0-1.471 1.7 1.7 0 0 1-.622-2.32l.801-1.389a1.7 1.7 0 0 1 2.32-.622A.85.85 0 0 0 5.5 2.2m4 5.8a1.5 1.5 0 1 1-3 0 1.5 1.5 0 0 1 3 0M11 8a3 3 0 1 1-6 0 3 3 0 0 1 6 0" clip-rule="evenodd"/></svg> at the top right and uncheck **Allow data export**.

     ![image](../../_assets/datalens/chart/dataset-export-disable.png)
  
  After you prohibit export:
  
  * Charts based on this dataset will no longer display the export option in their <!-- diplodoc:svg ![icon](../../_assets/console-icons/ellipsis.svg) --><svg xmlns="http://www.w3.org/2000/svg" width="16" height="16" fill="none" viewBox="0 0 16 16"><path fill="currentColor" fill-rule="evenodd" d="M3 9.5a1.5 1.5 0 1 0 0-3 1.5 1.5 0 0 0 0 3M9.5 8a1.5 1.5 0 1 1-3 0 1.5 1.5 0 0 1 3 0m5 0a1.5 1.5 0 1 1-3 0 1.5 1.5 0 0 1 3 0" clip-rule="evenodd"/></svg> menu, and users will be unable to export data from those charts.
  * However, they will still be able to copy data from the charts and take screenshots.

{% endlist %}
