---
metadata:
- name: generator
content: Diplodoc Platform v5.63.0
alternate:
- en/concepts/chart/settings
- ru/concepts/chart/settings
- href: en/concepts/chart/settings.md
type: text/markdown
title: Markdown version
csp:
- script-src:
- https://mc.yandex.ru
img-src:
- https://mc.yandex.ru
connect-src:
- https://mc.yandex.ru
- wss://mc.yandex.ru
child-src:
- 'blob:'
- https://mc.yandex.ru
frame-src:
- 'blob:'
- https://mc.yandex.ru
frame-ancestors:
- 'blob:'
- https://mc.yandex.ru
canonical: en/concepts/chart/settings.html
title: DataLens On-premises chart settings
description: >-
In this article, you will learn about DataLens On-premises chart settings and
how to undo and redo changes in charts.
vcsPath: en/concepts/chart/settings.md
---
# DataLens On-premises chart settings
Charts are configurable. For example, you can choose to display a legend, customize a color scheme, or set your own title.
Available settings depend on the type of chart being configured.
## General settings {#common-settings}
General settings affect the overall display of charts.
To open general settings, click on the left side of the screen above the chart.
{% note warning %}
The settings specified below may not be available for some chart types.
{% endnote %}
#|
|| **Name** | **Description** ||
|| Header | Sets the header for the chart.
Available values:
* **Hide**: Hide header.
* **Show**: Show header. You can enter the header text in the text field on the right. ||
|| Legend | Displays the legend below the chart. The legend contains chart colors with text descriptions referring to the field values in the **Colors** section.
Available values:
* **On**: Displays the legend if the field is specified in the **Colors** [section](#color-settings).
* **Off**: Hides the legend. ||
|| Tooltip | Displays tooltips when hovering over a chart item.
Available values:
* **On**: Shows the tooltip.
* **Off**: Hides the tooltip. ||
|| Sum in tooltips | Displays a sum in a tooltip when you hover over the chart.
Available values:
* **On**: Displays a sum in a tooltip.
* **Off**: Hides a sum in a tooltip. ||
|| Navigator | Displays an additional element below the chart, the navigator. It allows to reduce the data selection displayed on the chart.
Available values:
* **On**: Shows the navigator.
* **Off**: Hides the navigator.
For more information, see [this guide](../../operations/chart/config-chart-navigator.md). ||
|| Pagination | Breaks a table into pages. It is not available if only one page is displayed or there is no data.
Available values:
* **On**: Displays the table part by part across a number of pages.
* **Off**: Displays the whole table. ||
|| Limit | Sets the number of rows to export. This is also the number of rows displayed per page. Available if **Pagination** is enabled. ||
|| Grouping | Displays unique field values.
Available values:
* **On**: Displays unique values.
* **Off**: Displays all values. ||
|| Summary | Displays a row with total values for table columns. The row values are calculated using the same formulas as [aggregation](../../dataset/data-model.md#aggregation) in the measure.
Available values:
* **On**: Shows the **Total** row.
* **Off**: Hides the **Total** row. ||
|| Preserving spaces and line breaks | Displays spaces and line breaks in the table as in the source data.
Available values:
* **On**: Display all spaces and line breaks.
* **Off**: Reduce multiple spaces and line breaks to a single space. ||
|| Stacking | Stacked or isolated data display for each category in the [area chart](../../visualization-ref/area-chart.md#stacking).
Available values:
* **On**: Displays stacked data.
* **Off**: Displays unstacked data. ||
|#
## Field settings {#field-settings}
You can configure:
* Both dimensions and measures for [charts based on a dataset](./dataset-based-charts.md).
* Only measures for [QL charts](./ql-charts.md).
To open settings of a dimension or a measure, click the icon to the left of its name.
{% note info %}
If you apply an aggregation to the dimension, it will become a measure and the relevant settings will become available for it.
{% endnote %}
### Dimensions {#measure-settings}
#|
|| **Name** | **Description** ||
|| Name | Sets a dimension name. ||
|| Type | Sets the type of dimension data. ||
|| Grouping | Sets the type of grouping or rounding. The setting is only available for the `Date` and `Date and time` type dimensions. ||
|| Format | Sets the format of how the values are displayed. ||
|| Date mode | Sets the date display mode. The setting is only available for the `Date` and `Date and time` type dimensions.
Available values:
* **Continuous**: Displays all dates continuously.
* **Discrete**: Displays dates that contain values. ||
|| Aggregation | Sets the aggregation type. Aggregation functions are available according to the [Aggregating data](../../dataset/data-model.md#aggregation) table. ||
|| Markup | The field value will be formatted according to the option you select:
* `None`: No markup.
* `HTML`: HTML markup. Available only for `String` type fields. Here is an example:
```html
'' +
str([Product - category])
+ ''
```
* `Markdown`: [Markdown in DataLens On-premises](../../dashboard/markdown.md) markup. Available only for `String` type fields in relevant sections depending on visualization type.
#|
|| **Visualization types** | **Sections** ||
|| [Scatter chart](../../visualization-ref/scatter-chart.md) | X, Y, Points, [Colors](#color-settings), Shapes ||
|| [Tree chart](../../visualization-ref/tree-chart.md) | Dimensions ||
|| [Line](../../visualization-ref/line-chart.md), [Column](../../visualization-ref/column-chart.md), [Bar](../../visualization-ref/bar-chart.md), [Pie](../../visualization-ref/pie-chart.md), [Ring](../../visualization-ref/ring-chart.md), and [Area](../../visualization-ref/area-chart.md) chart | [Labels](#sign) ||
|#
This setting is not available in the following visualizations: [Indicator](../../visualization-ref/indicator-chart.md), [Table](../../visualization-ref/table-chart.md), and [Pivot table](../../visualization-ref/pivot-table-chart.md). ||
|| Sub-totals | Shows columns and/or rows with subtotals. This setting is only available for [Pivot table](../../visualization-ref/pivot-table-chart.md) charts. ||
|#
### Measures {#indicator-settings}
#|
|| **Name** | **Description** ||
|| Name | Sets the measure name. ||
|| Type | Sets the type of measure data. Not available for [QL charts](./ql-charts.md). ||
|| Aggregation | Sets the aggregation type. Aggregation functions are available according to the [Aggregating data](../../dataset/data-model.md#aggregation) table. Not available for [QL charts](./ql-charts.md). ||
|| Format | Sets value display format. ||
|| Decimal places | Sets the number of decimal places. Not available for [QL charts](./ql-charts.md). ||
|| Display groups of thousands | Enables displaying groups of thousands for numeric values.
Available values:
* **With separator**: Displays spaces between groups of thousands.
* **Merged**: Hide spaces between groups of thousands. ||
|| Prefix | Sets a text displayed before a value. ||
|| Postfix | Sets a text displayed after a value. ||
|| Dimension | Sets a rounding scale of values. ||
|#
## Section settings {#section-settings}
To open section settings, click in the row with the section name.
### Axes {#axis-settings}
Axis settings are only available for charts that have at least one X or Y axis:
* Line chart.
* Area chart (stacked and normalized).
* Column chart (including normalized).
* Bar chart (including normalized).
* Scatter chart.
You can configure settings for both the **X** and **Y** axes.
{% note warning %}
Some of these settings may not be available for some axes.
{% endnote %}
#|
|| **Name** | **Description** ||
|| Axis name | Sets an axis label.
Available values:
* **On**: Use the field name. If the section contains multiple fields, DataLens uses the name of the field listed first.
* **Off**: No axis label displayed.
* **Manually**: Allows setting an axis name manually in a text field. ||
|| Axis type | Defines the axis type. This setting is available if the fields in the axis section are of the `Fractional number` type.
Available values:
* **Linear**: Use linear axis.
* **Logarithmic**: Use logarithmic axis. Suitable for charts with a large spread of values. The logarithmic axis allows you to display a fast-growing graph in a convenient form for analysis, reducing values by an order of magnitude. ||
|| Graph axis | This setting allows you to hide all axis elements: lines, labels, and grid.
Available values:
* **Show**: Displays all axis elements.
* **Hide**: Hides all axis elements. ||
|| Display mode | Enables configuring continuous chart display.
Available values:
* **Discrete**: Plots the chart only for non-null values.
* **Continuous**: Plots the chart for all values continuously. You can only use continuous mode for the `Integer`, `Fractional number`, `Date`, or `Date and time` data types. ||
|| Axis formatting | Sets the formatting of axis labels with numeric values, date values, or date and time values.
Available values:
* **Auto**: Default formatting.
* **By first field on the X axis**: Displays the X axis labels with the formatting specified in the **Format** setting for the first field in the **X** section. Available in the X axis settings for numeric values.
* **By first field on the Y axis**: Displays the Y axis labels with the formatting specified in the **Format** setting for the first field in the **Y** section. Available in the Y axis settings for numeric values.
* **Manually**: Allows setting formatting parameters corresponding to field data type in the axis section. Available for numeric values, date values, or date and time values. ||
|| Grid | Enables or disables grid display on the chart.
Available values:
* **On**: Shows grid.
* **Off**: Hides grid. ||
|| Grid increments, px | Sets grid increment in pixels. Available if the **Grid** setting is on.
Available values:
* **Auto**: Calculates grid size automatically.
* **Manual**: Specify grid size in pixels. ||
|| Labels | Shows or hides axis labels based on field values.
Available values:
* **On**: Shows axis labels.
* **Off**: Hides axis labels. ||
|| Label appearance | Sets the way the labels are displayed. Available if the **Labels** setting is on.
Available values:
* **Auto**: Displays axis labels.
* **Horizontal**: Displays axis labels horizontally.
* **Vertical**: Displays axis labels vertically.
* **Angled**: Displays axis labels at a 45-degree angle. ||
|| Null values | Allows you to select the handling method for null values.
Available values:
* **Hide**: Hides null values in charts.
* **Connect**: Connects field values where there are null values in between.
* **Display as 0**: Displays null values in charts as zero (0) field values.
* **Use previous**: Replaces null values with the value of the preceding point on the axis. Available in the Y axis settings for the [stacked chart](../../visualization-ref/area-chart.md).||
|| Scaling | Sets the chart axis scale.
Available values:
* **Auto**: Enables autoscaling. You can specify how DataLens sets the scale: from 0 to the maximum field value (**Autoscale from 0 to max**) or from the minimum to the maximum field values (**Autoscale from min to max**).
* **Manually**: Requires manual input of the axis scale. You can set the maximum and minimum values along the axis. DataLens will trim the chart lines by this value. ||
|#
### Colors {#color-settings}
[Generally](#color-general-settings), you can set a specific color for any graph value.
You can [create color palettes](../../operations/chart/create-palette.md) and use them in your charts.
If the **Legend** option is enabled in [common settings](#common-settings), placing this field into the **Colors** section will make the legend visible below the chart. The legend contains chart colors with text descriptions corresponding to the field values in the **Colors** section.
For [tree chart](../../visualization-ref/tree-chart.md), [table](../../visualization-ref/table-chart.md) (including a [pivot table](../../visualization-ref/pivot-table-chart.md)), the following settings are available:
#|
|| **Name** | **Description** ||
|| Gradient type | Sets the number of gradient colors.
Available values:
* **Two-color**: Sets two colors for the gradient.
* **Tree-color**: Sets three colors for the gradient. ||
|| Colors | Sets a color for a value. Available colors depend on the gradient type. ||
|| Set threshold values | Allows you to set threshold values that will refer to each color. ||
|| Borders | Sets borders for geopolygons.
Available values:
* **Show**: Displays geopolygon borders.
* **Hide**: Hides geopolygon borders. ||
|#
#### General color settings {#color-general-settings}
To set up colors:
1. In the top-right corner of the **Colors** section, click (the icon is displayed when you hover over the section).
1. Specify the configuration:
{% note info %}
You can use the **Palette** type for dimensions and the **Gradient** type for measures.
{% endnote %}
{% list tabs group=fill %}
- For a dimension {#measure}
1. Set a color in one of the following ways:
* Select a color palette from the preset options or one [created](../../operations/chart/create-palette.md) by the user. You can set a color for each dimension from the preset options of the current color palette. To revert to the default colors for the current palette, click **AUTO**.
{% cut "Selecting a color from the color palette" %}
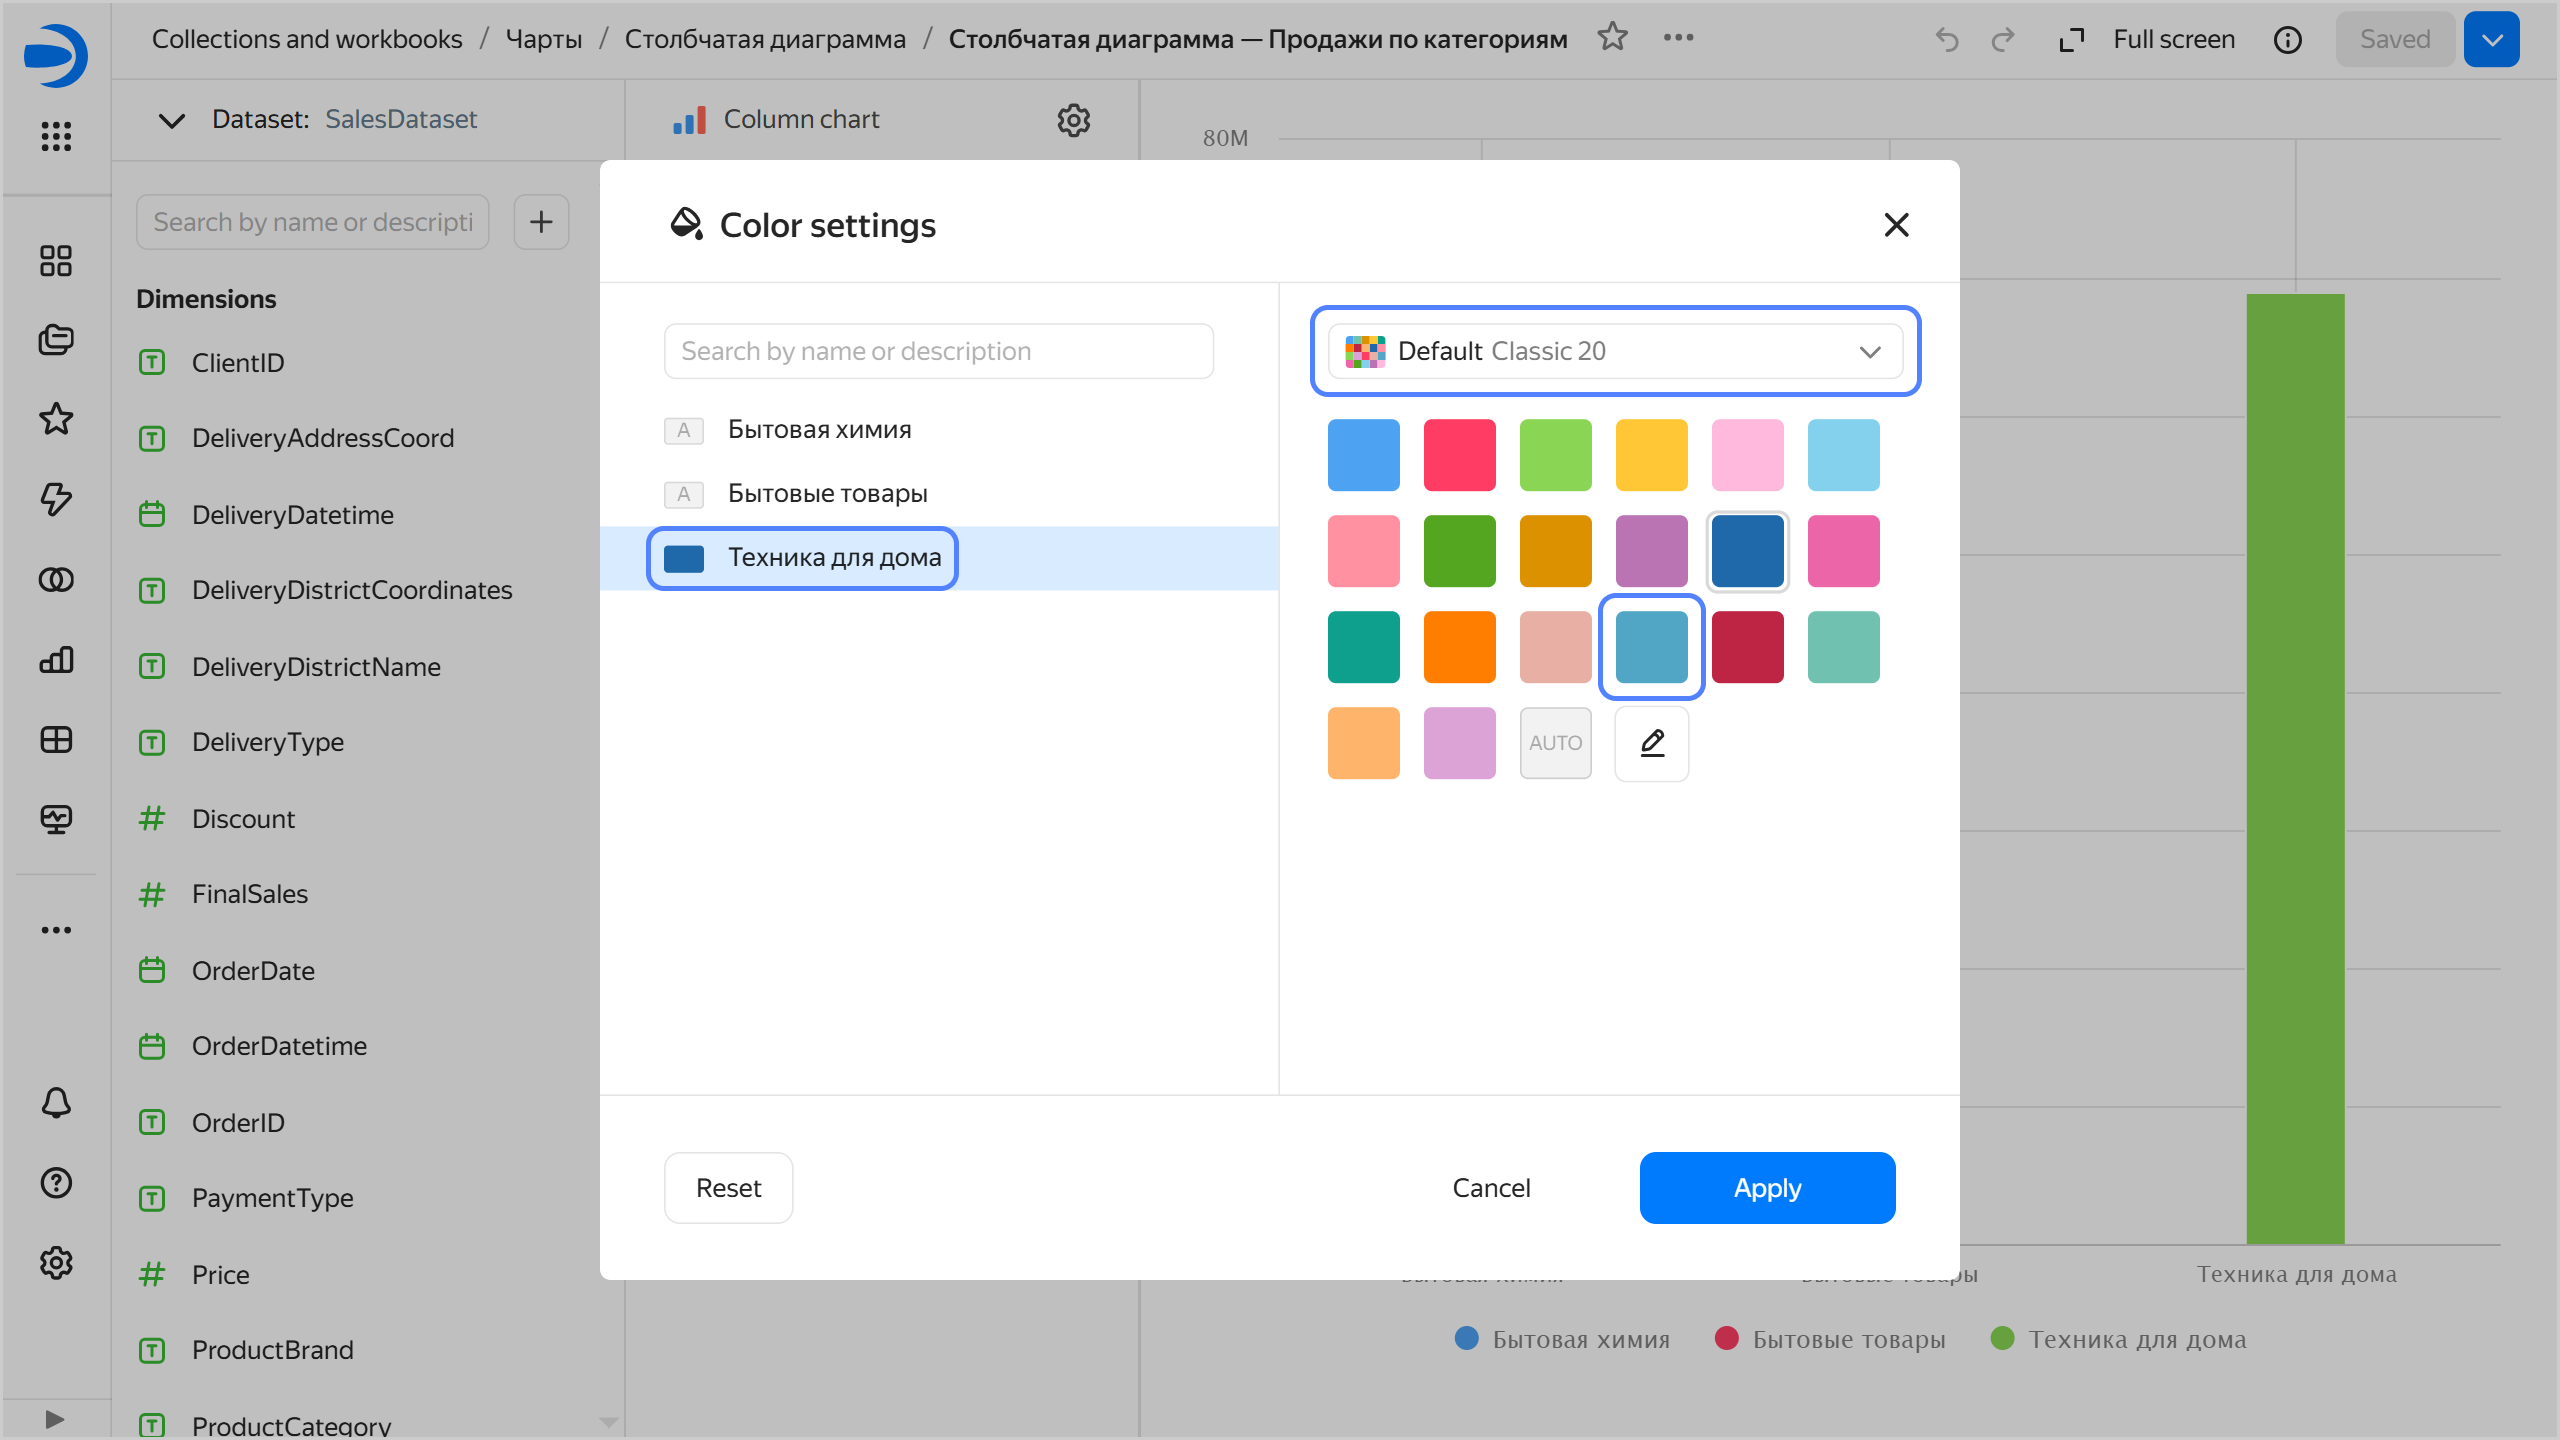
{% endcut %}
* Click and set the color in hex format. You can also specify background transparency as a percentage.
{% cut "Setting a color in hex format" %}
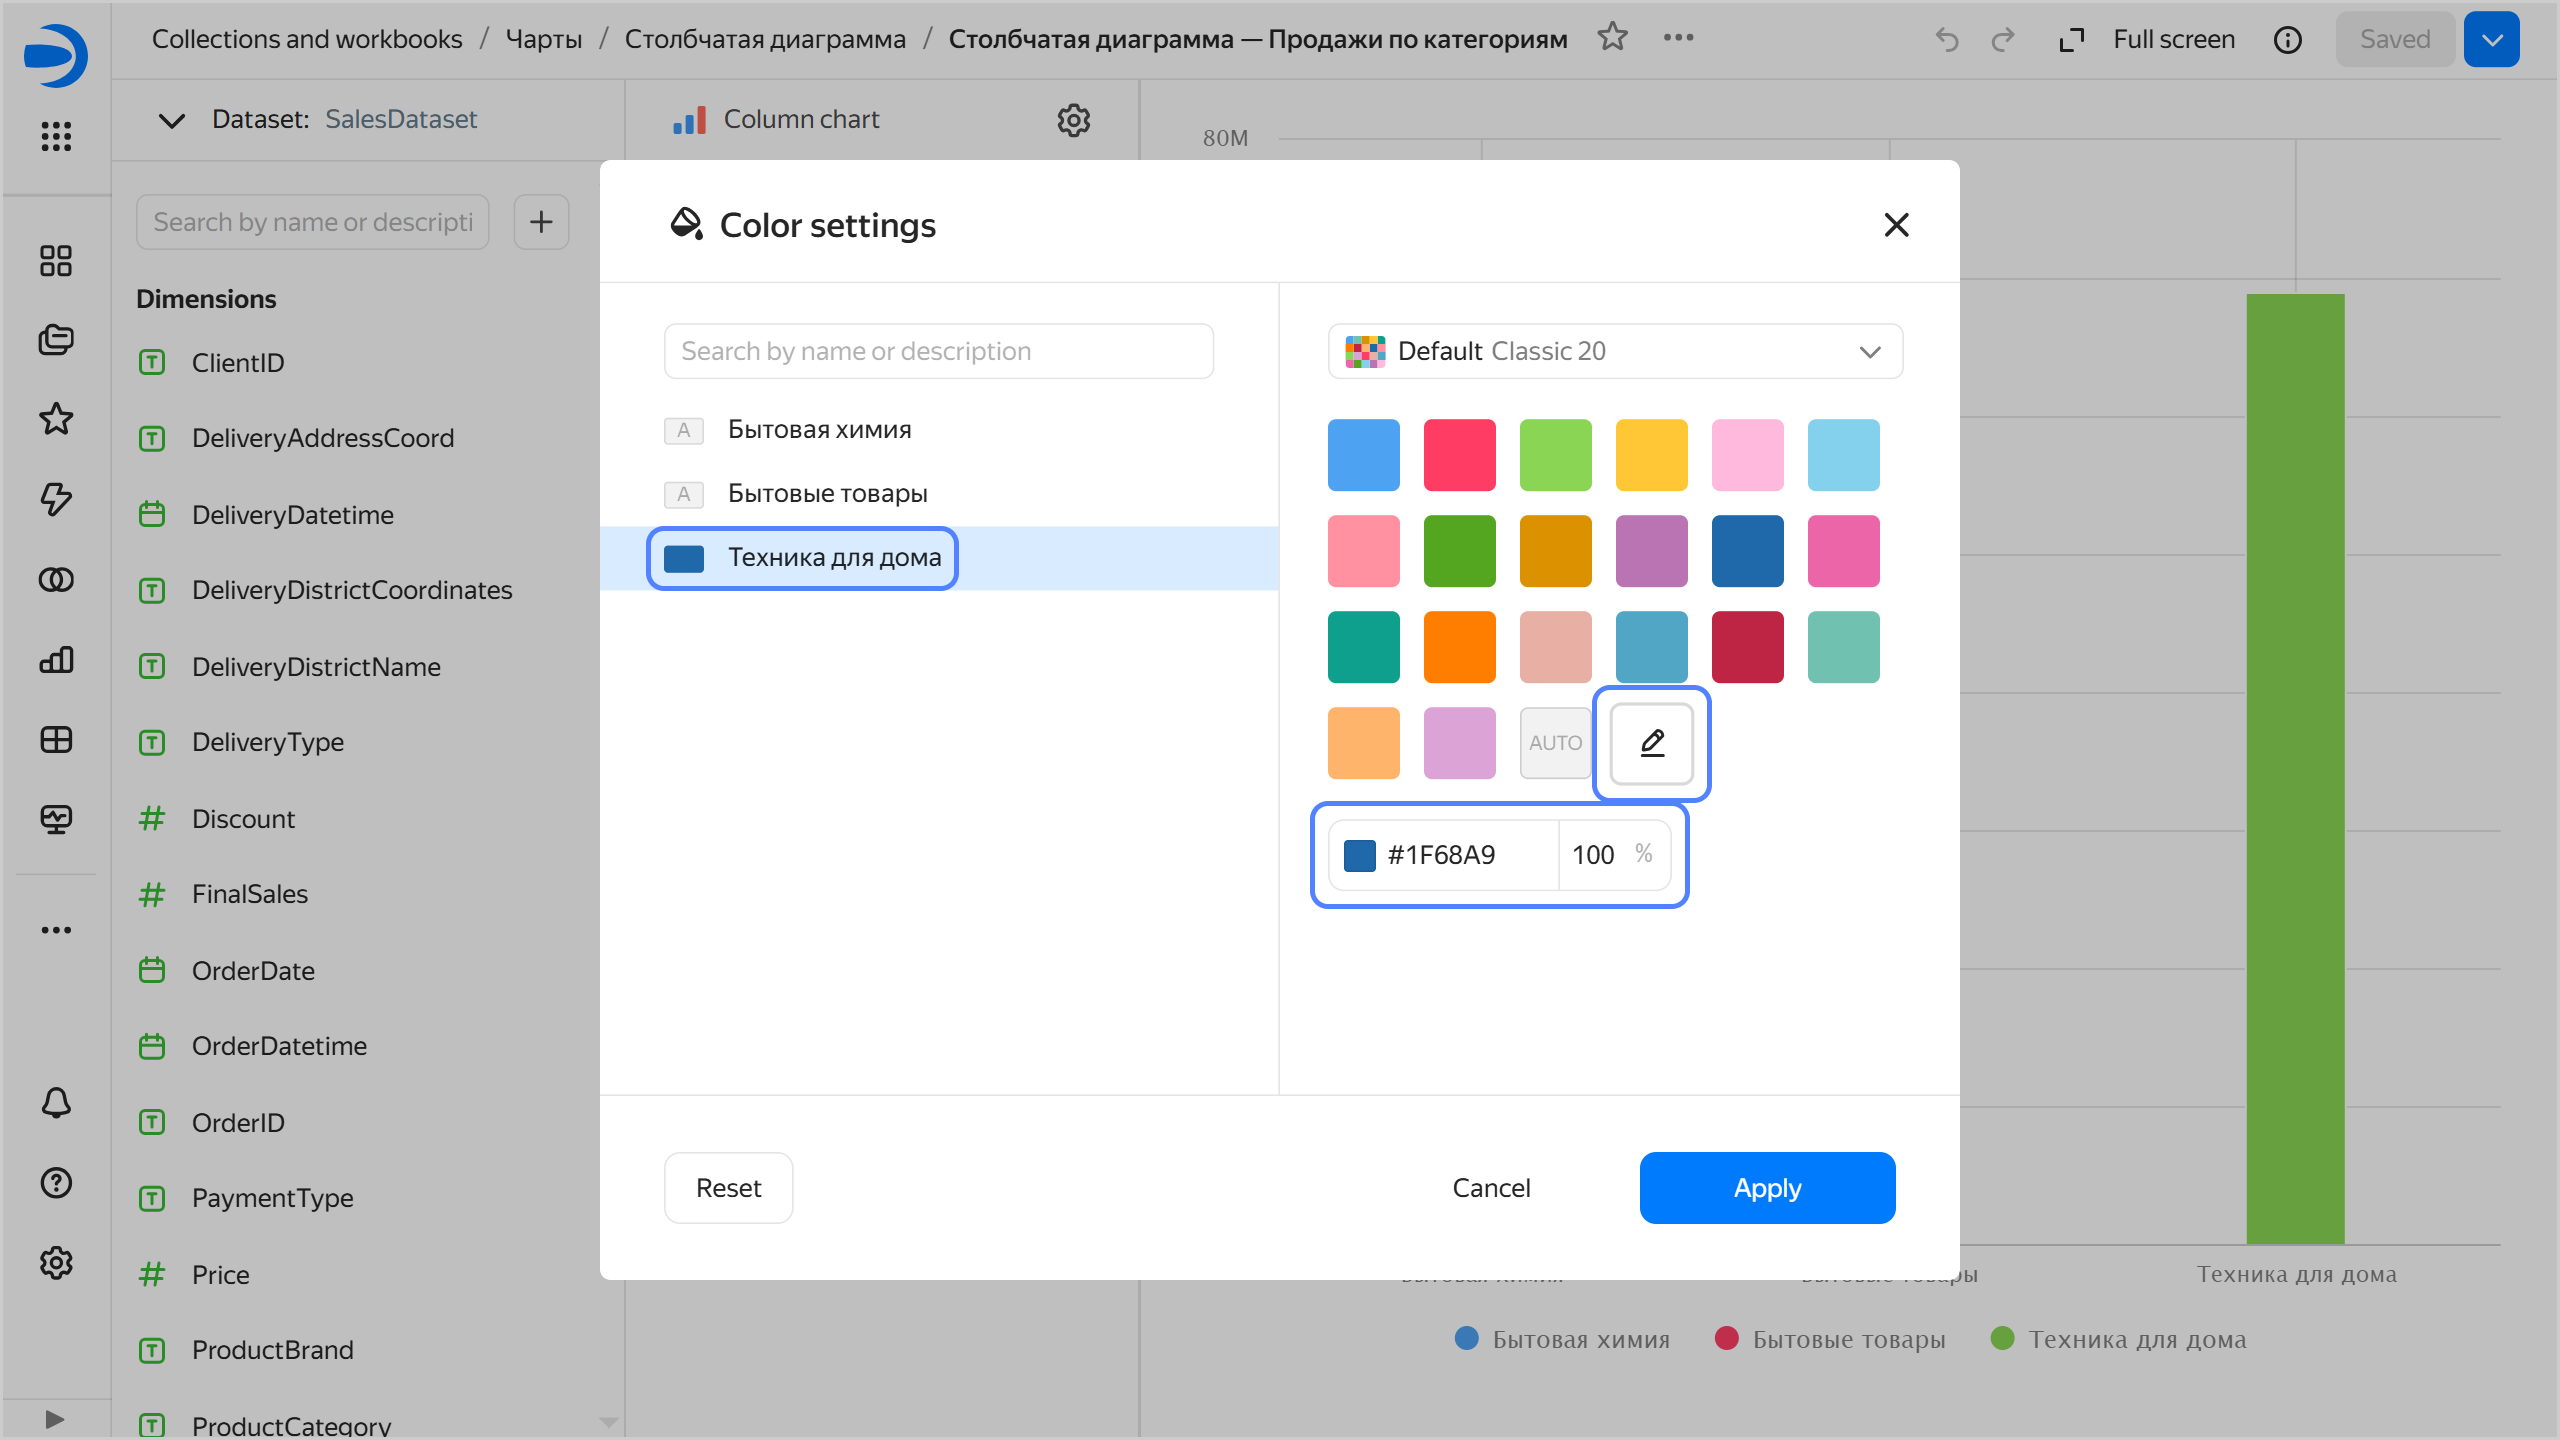
{% endcut %}
* Click and then click the color icon preceding its hex value. In the window that opens, select a color from the color palette or specify a color in RGB, HSL, or hex format. To switch between formats, click .
{% cut "Switching between color formats" %}
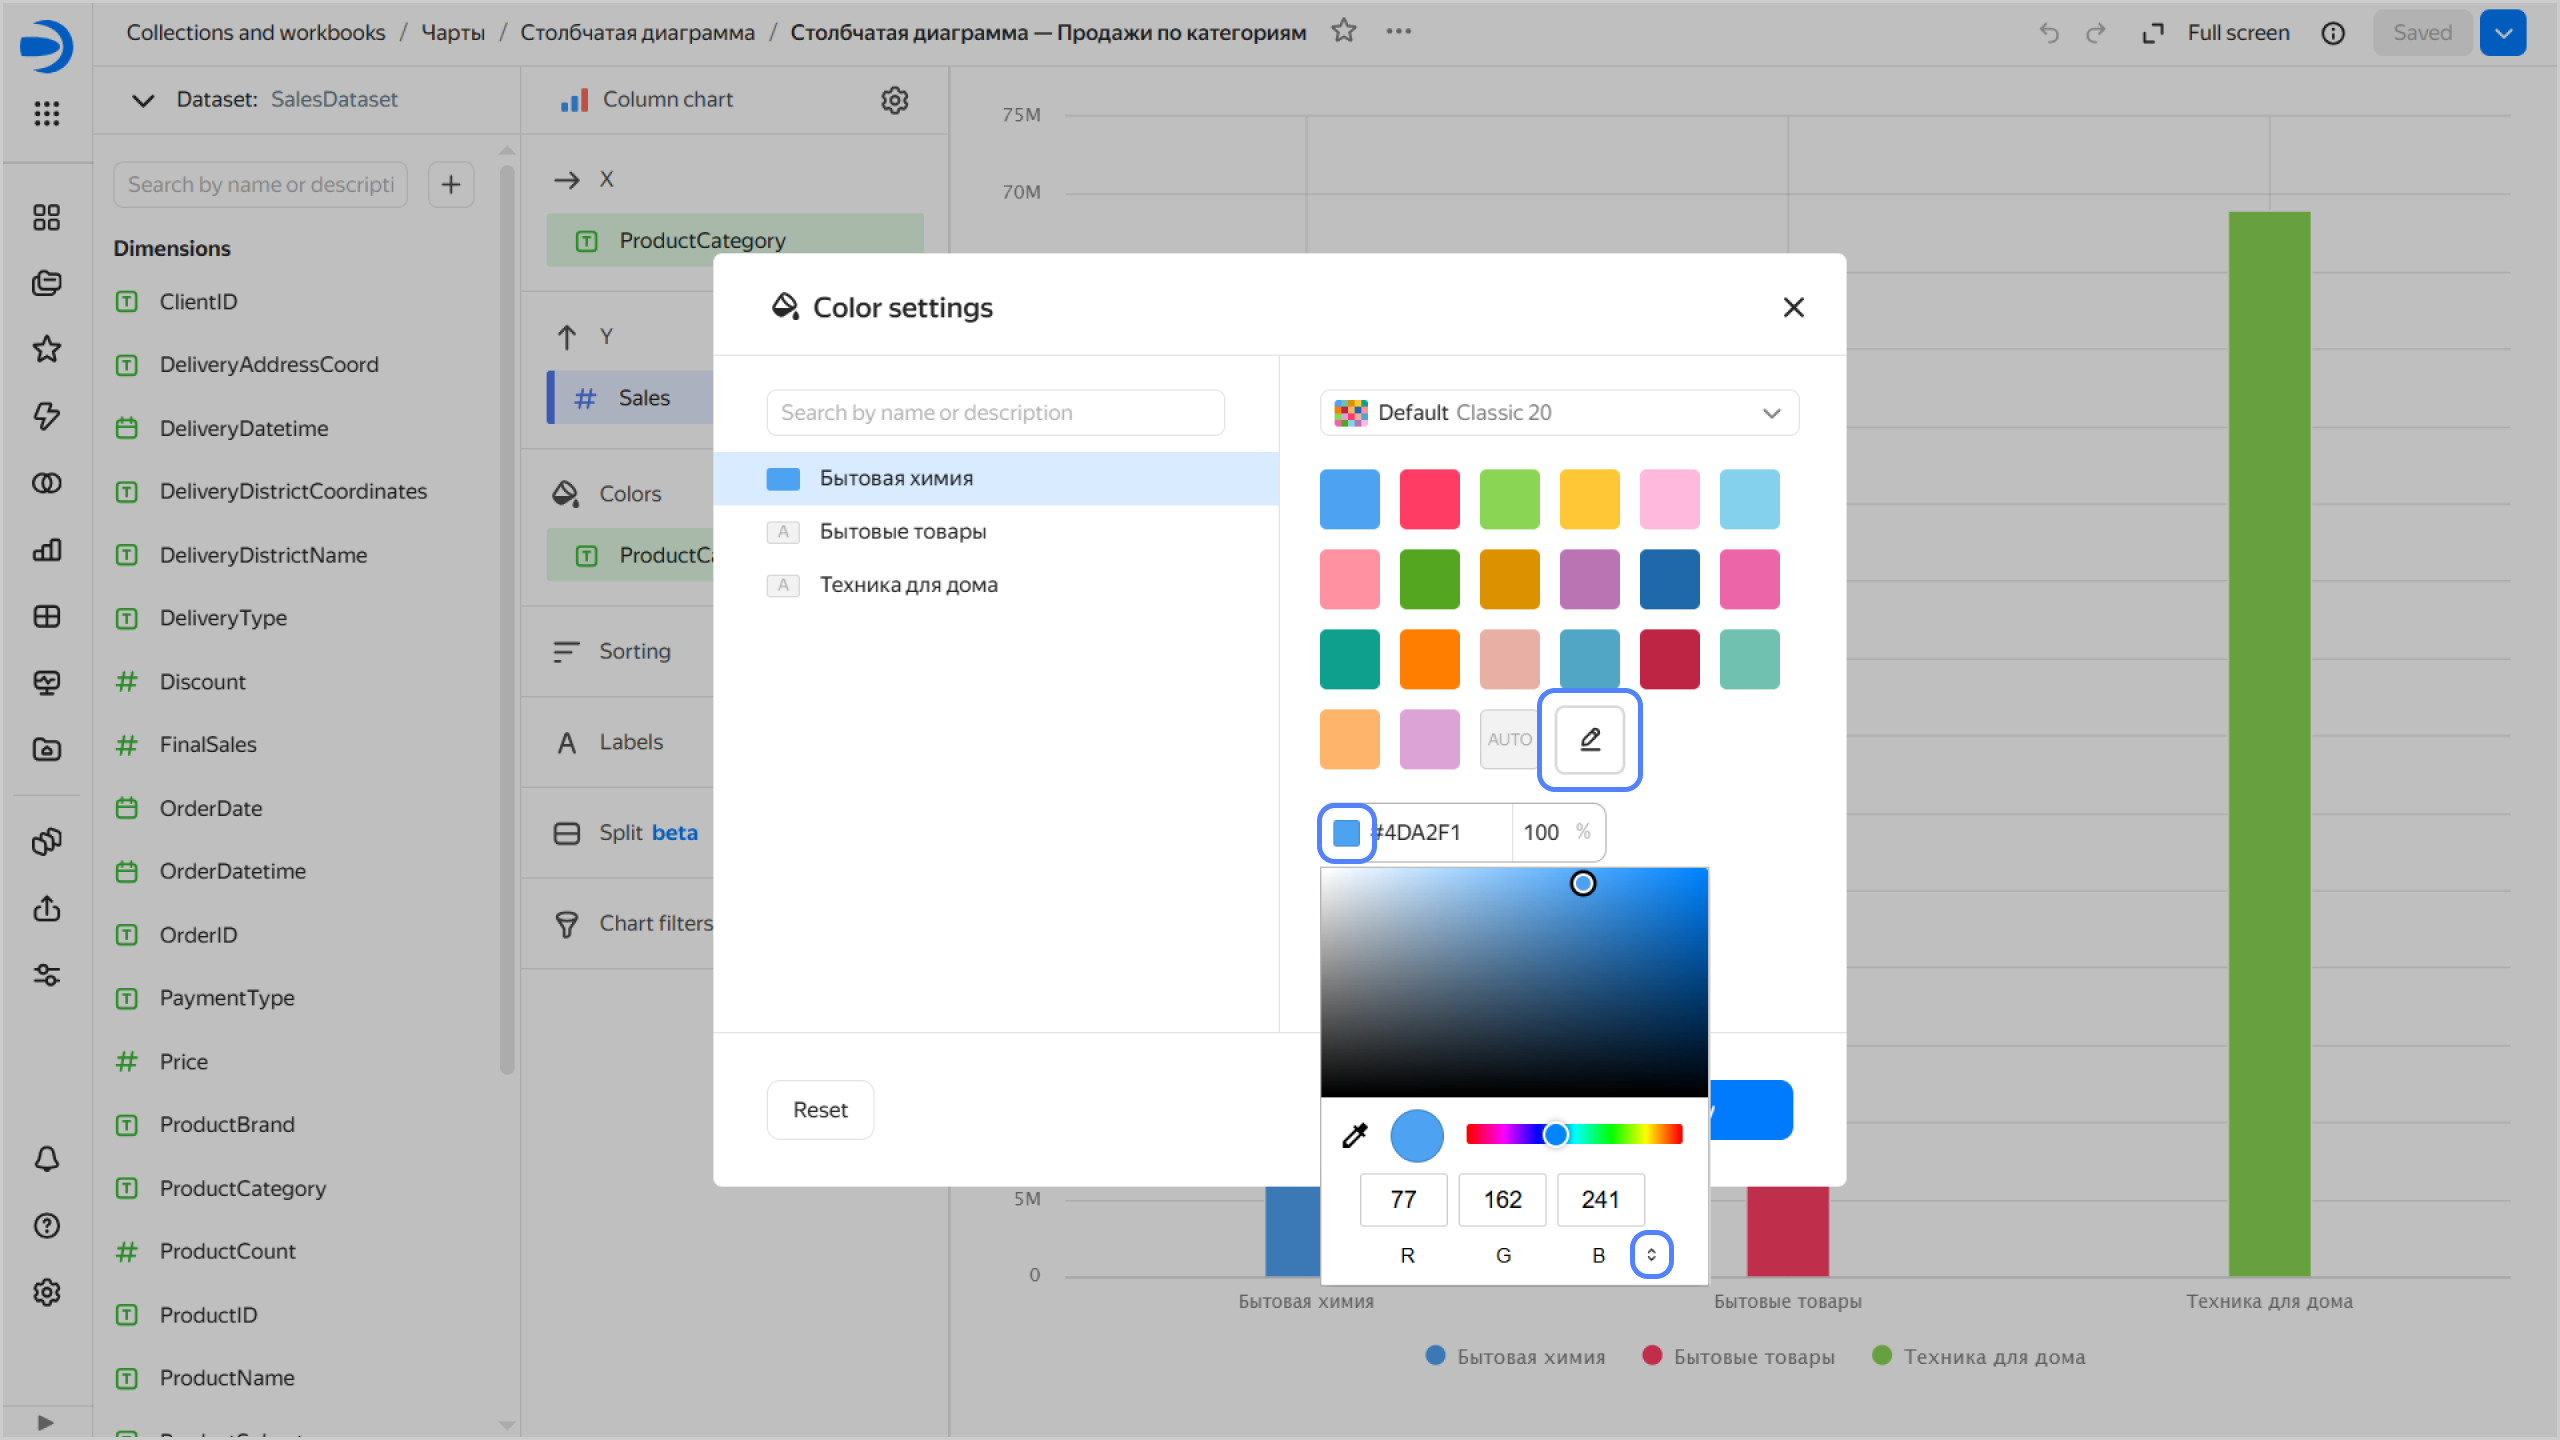
{% endcut %}
You can also use the eyedropper tool to select a color on the report page.
{% cut "Picking a color on the screen" %}
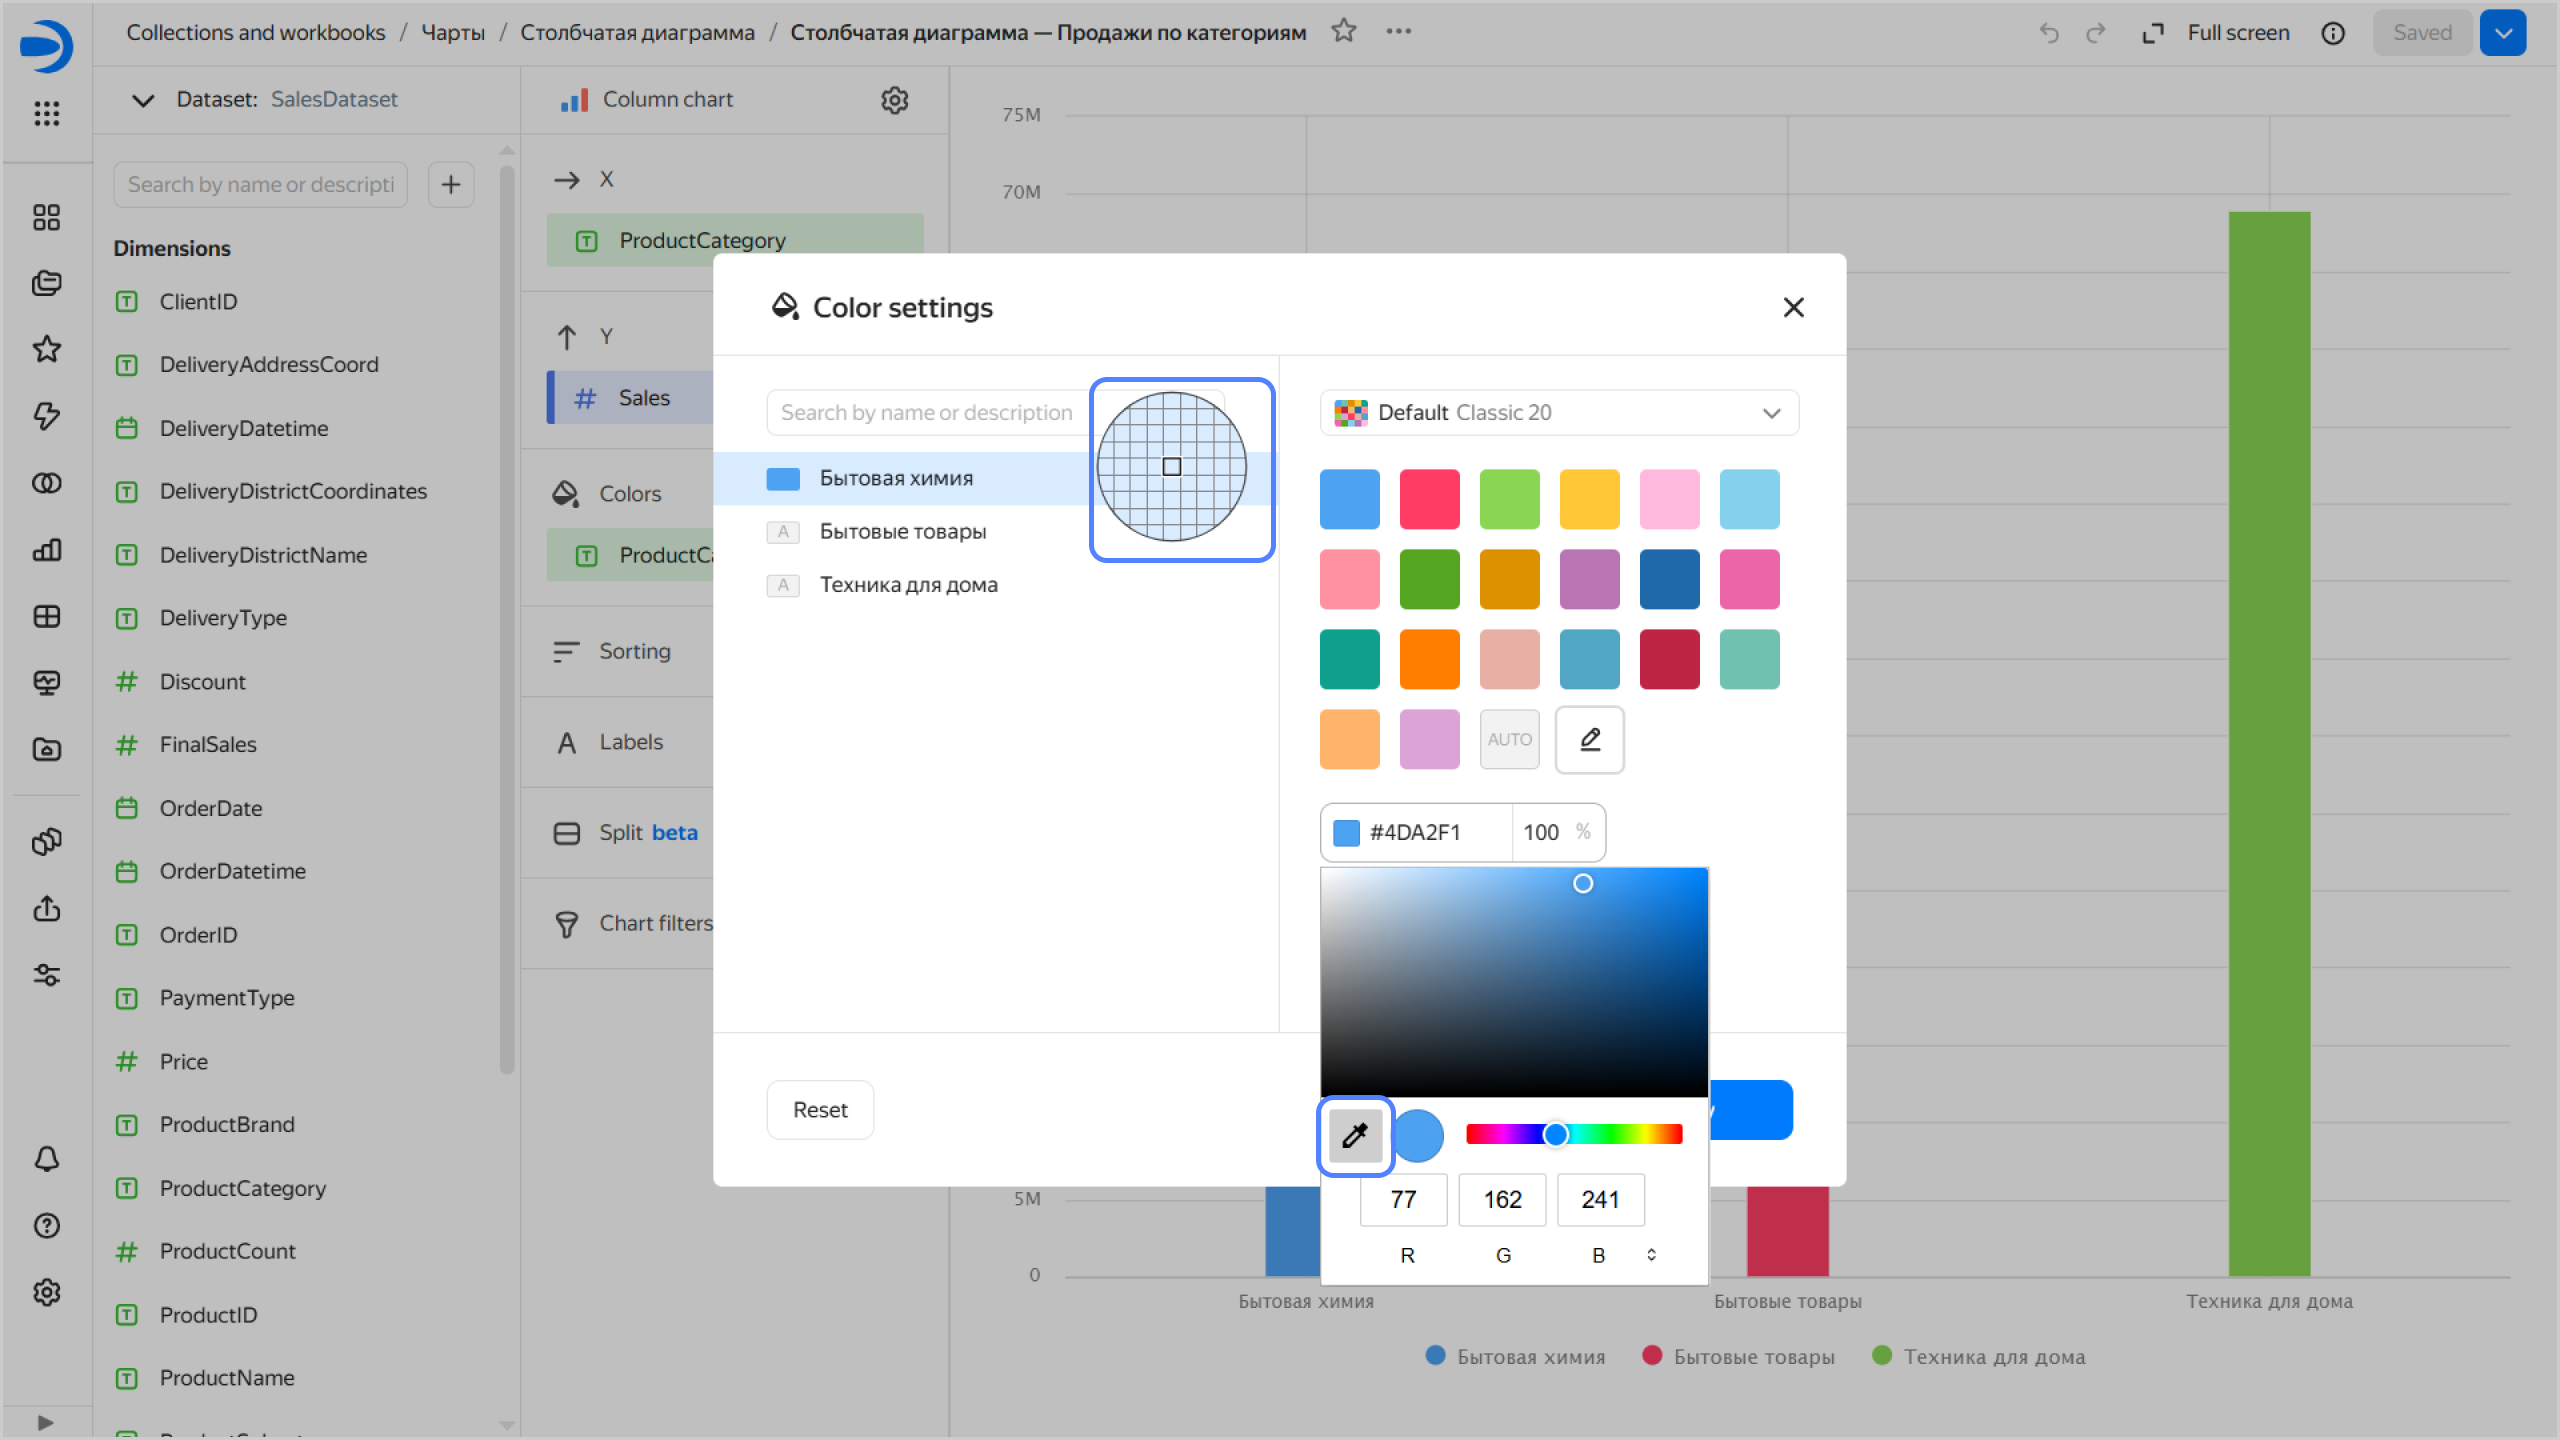
{% endcut %}
1. Click **Apply**.
- For a measure {#indicator}
1. Click the gradient selection field and set the following properties:
* **Gradient type**: Select two or three colors.
* Gradient color: Select a color palette for the gradient from the list.
* Gradient direction: Change the gradient direction using the icon.
* **Set threshold values**: Set numeric thresholds for each color.
1. Click **Apply**.
{% endlist %}
You can [create color palettes](../../operations/chart/create-palette.md) and use them in your charts.
### Forms {#forms-settings}
This setting is only available for [line](../../visualization-ref/line-chart.md) (including as part of a [combined](../../visualization-ref/combined-chart.md) chart) and [scatter](../../visualization-ref/scatter-chart.md) charts in the [wizard](../chart/dataset-based-charts.md) and in [QL charts](../chart/ql-charts.md).
In a line chart, the setting allows you to set line shape and size, as well as line cap and junction style for a dimension or the [Measure Names](./measure-values.md) field. To configure line shapes and sizes:
1. In the top-right corner of the **Forms** section, click (the icon appears when you hover over the section).
1. On the **Lines** tab, specify the following for each value:
* Select line thickness from the list or enter manually, from `1` to `12` pixels. If you select `Auto`, the size from the **General settings** tab or the default size will be used.
* Select line shape from the preset values. If you select `Auto`, the shape from the **General settings** tab or the default shape will be used.
{% cut "Line settings" %}

{% endcut %}
1. In the **General settings** tab, set thickness, junction shape, and line caps for all values from the **Lines** tab.
{% cut "General line settings" %}

{% endcut %}
In the scatter chart, the setting allows you to set the shape of the dimension points by selecting it from the preset shapes.
### Labels {#sign}
Labels display measure values on the chart. [Markup functions](../../function-ref/markup-functions.md) are supported. For `String` type fields, you can configure using basic [Markdown in DataLens On-premises](../../dashboard/markdown.md) syntax: click the icon before the field name and enable **Markdown**.
Labels are available for the following charts types:
* Line chart.
* Area chart (stacked and normalized).
* Column chart (including normalized).
* Bar chart (including normalized).
* Pie chart.
* Map.
### Sorting {#sort}
Allows you to sort chart values by measure or dimension.
Sorting is available for the following chart types:
* Line chart.
* Area chart (stacked and normalized).
* Column chart (including normalized).
* Bar chart (including normalized).
* Pie chart.
* Table (including a Pivot table).
### Filters {#filter}
Filters allow you to make a selection of values by dimension or measure.
Filters are available for all chart types.
## Undoing and redoing changes in charts {#undo-redo}
When editing a chart in the wizard or a [QL chart](./ql-charts.md), you can now undo/redo any change introduced within the current [version](./versioning.md):
* To undo changes, click in the top-right corner of the screen or press **Ctrl** (**Cmd**) + **Z**.
* To redo changes, click or press **Ctrl** (**Cmd**) + **Shift** + **Z**.
You undo and redo changes that result in [creating a new version](./versioning.md#version-create).
Unsaved changes in the current version are reset:
* When refreshing the page.
* When saving a chart.
* When switching to another version.