---
metadata:
  - name: generator
    content: Diplodoc Platform v5.63.0
alternate:
  - en/operations/chart/add-description
  - ru/operations/chart/add-description
  - href: en/operations/chart/add-description.md
    type: text/markdown
    title: Markdown version
csp:
  - script-src:
      - https://mc.yandex.ru
    img-src:
      - https://mc.yandex.ru
    connect-src:
      - https://mc.yandex.ru
      - wss://mc.yandex.ru
    child-src:
      - 'blob:'
      - https://mc.yandex.ru
    frame-src:
      - 'blob:'
      - https://mc.yandex.ru
    frame-ancestors:
      - 'blob:'
      - https://mc.yandex.ru
title: How to add chart info in DataLens On-premises
description: Follow this guide to add chart info in DataLens On-premises.
canonical: en/operations/chart/add-description.html
vcsPath: en/operations/chart/add-description.md
---

# Adding chart info in DataLens On-premises

To add chart info, do the following:

1. Open the chart to add info for.
1. Click <!-- diplodoc:svg ![image](../../_assets/console-icons/circle-info.svg) --><svg xmlns="http://www.w3.org/2000/svg" width="16" height="16" fill="none" viewBox="0 0 16 16"><path fill="currentColor" fill-rule="evenodd" d="M8 13.5a5.5 5.5 0 1 0 0-11 5.5 5.5 0 0 0 0 11M8 15A7 7 0 1 0 8 1a7 7 0 0 0 0 14m1-9.5a1 1 0 1 1-2 0 1 1 0 0 1 2 0m-.25 3a.75.75 0 0 0-1.5 0V11a.75.75 0 0 0 1.5 0z" clip-rule="evenodd"/></svg> at the top of the screen.
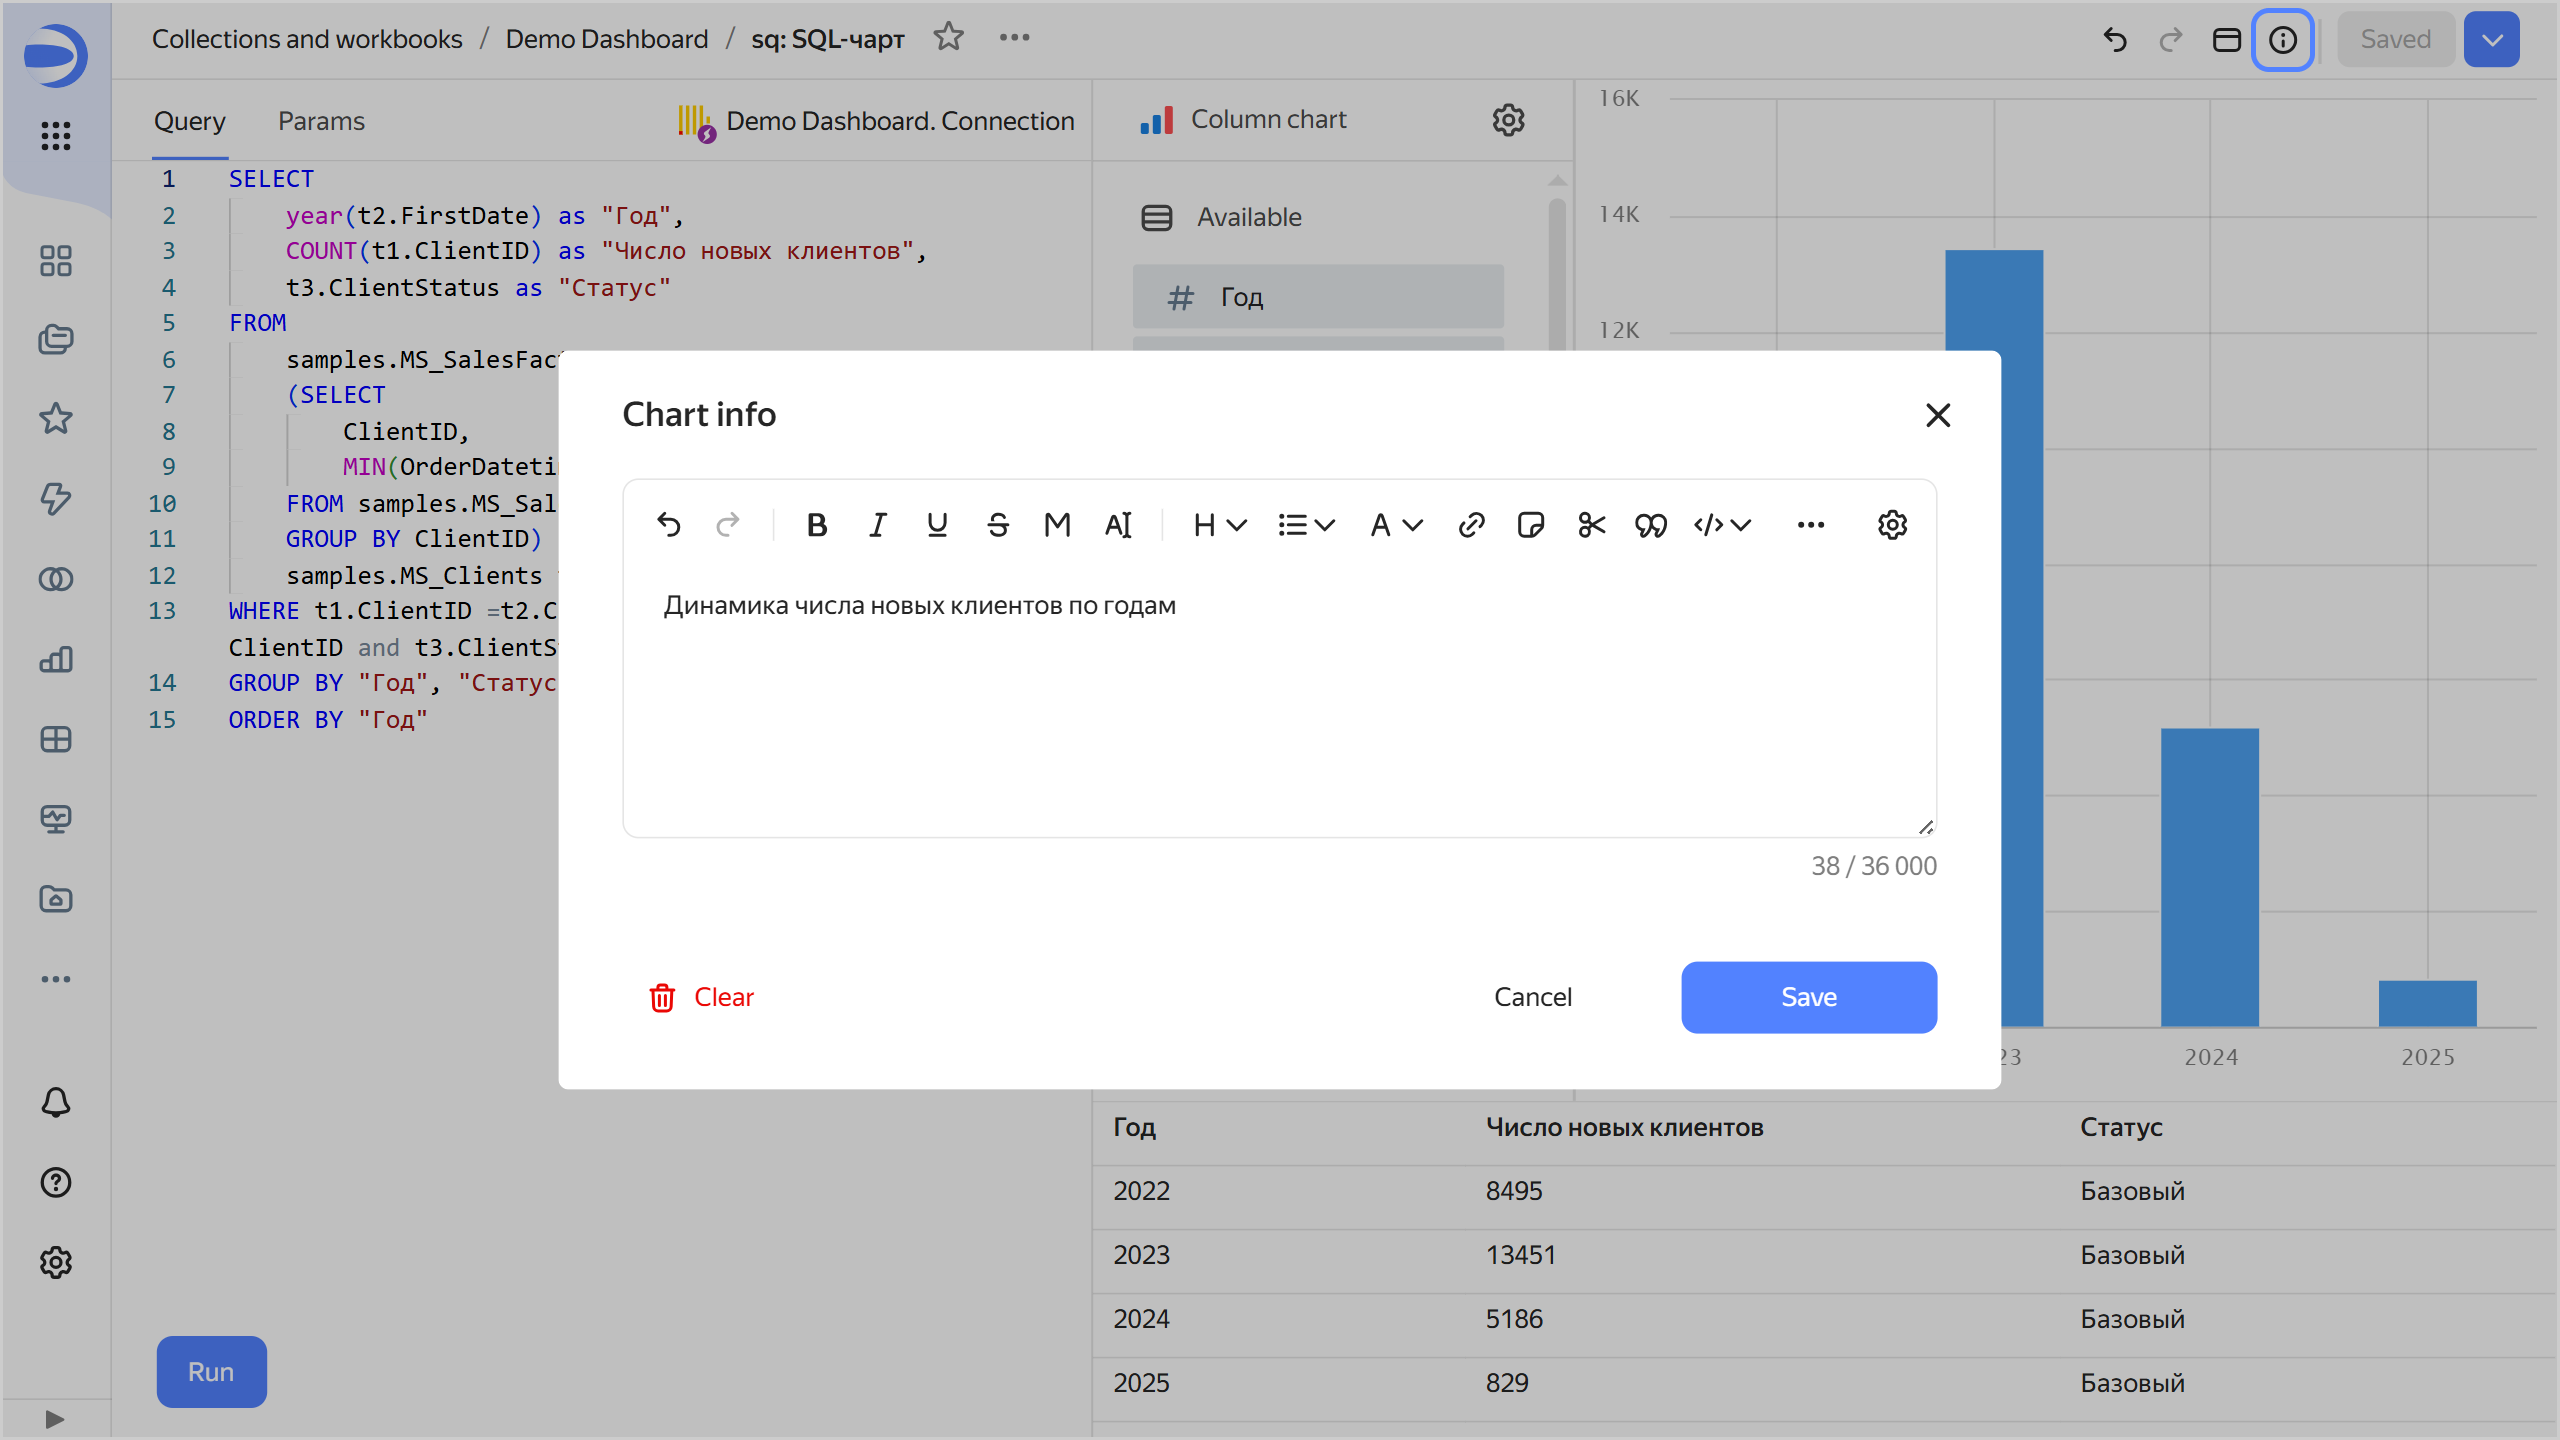
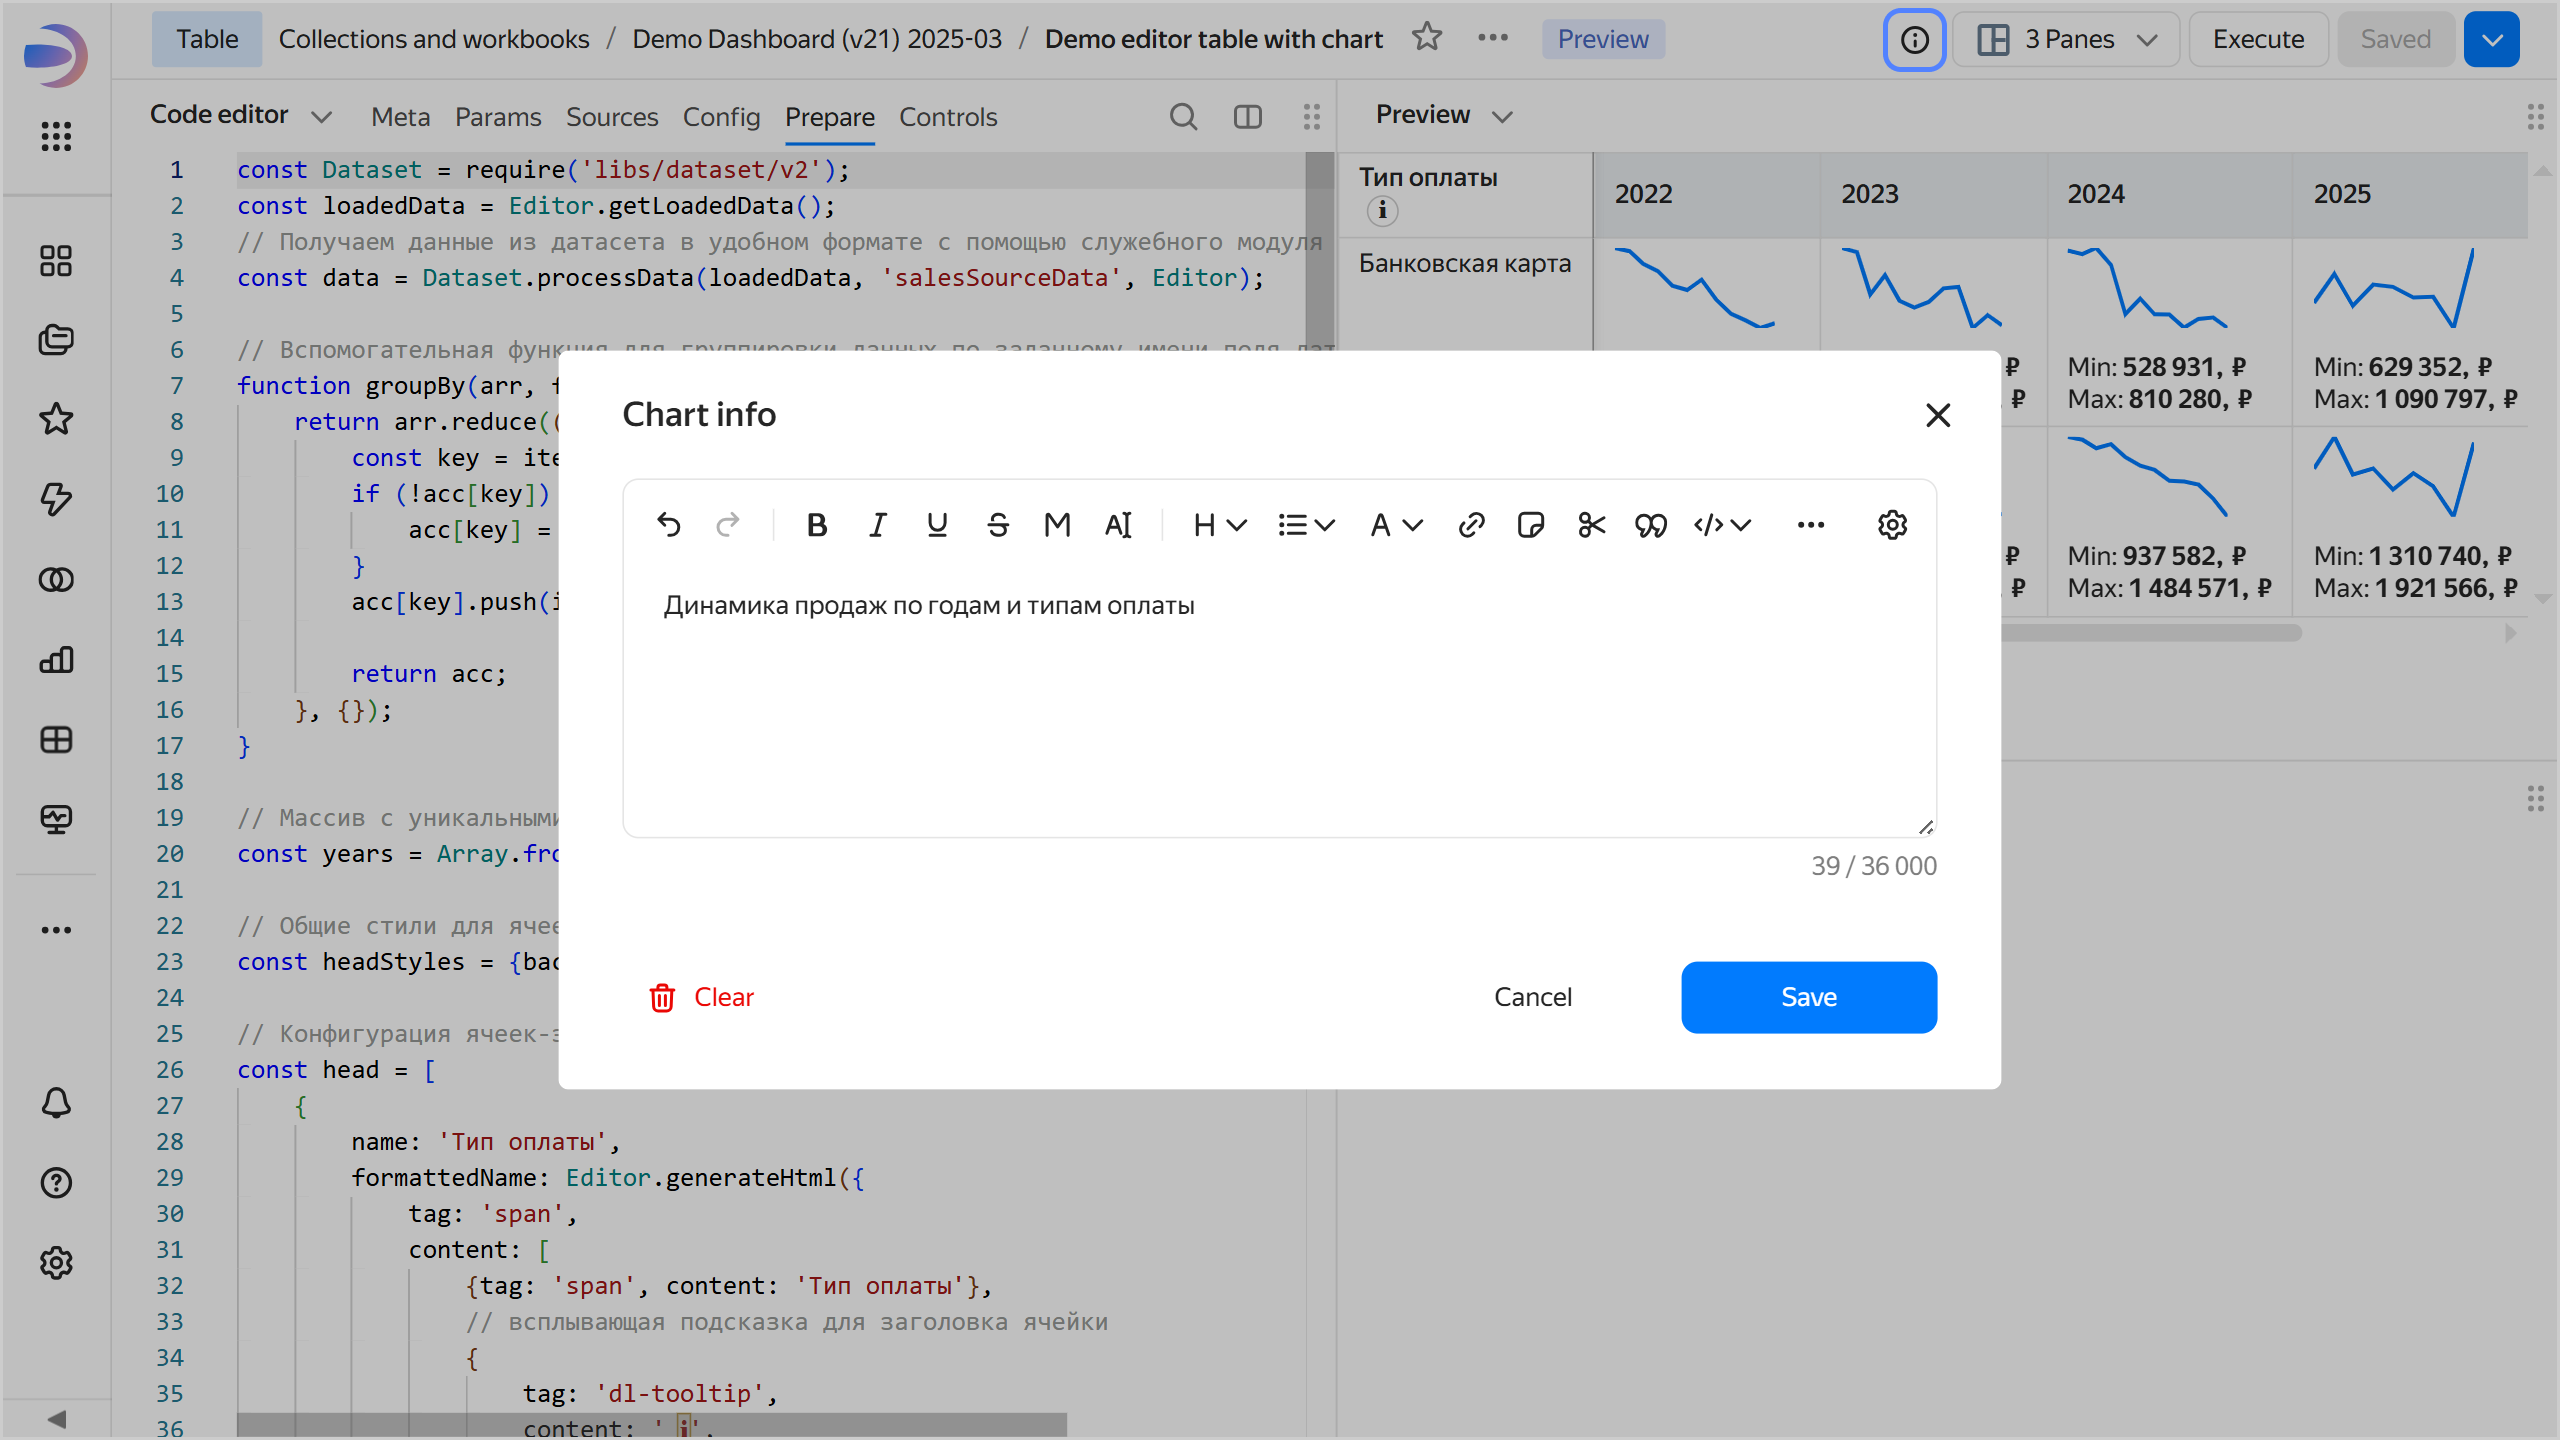
1. Enter the information and click **Save**.

   {% cut "Adding chart info" %}

   {% list tabs group=charts %}

   - Wizard {#wizard}
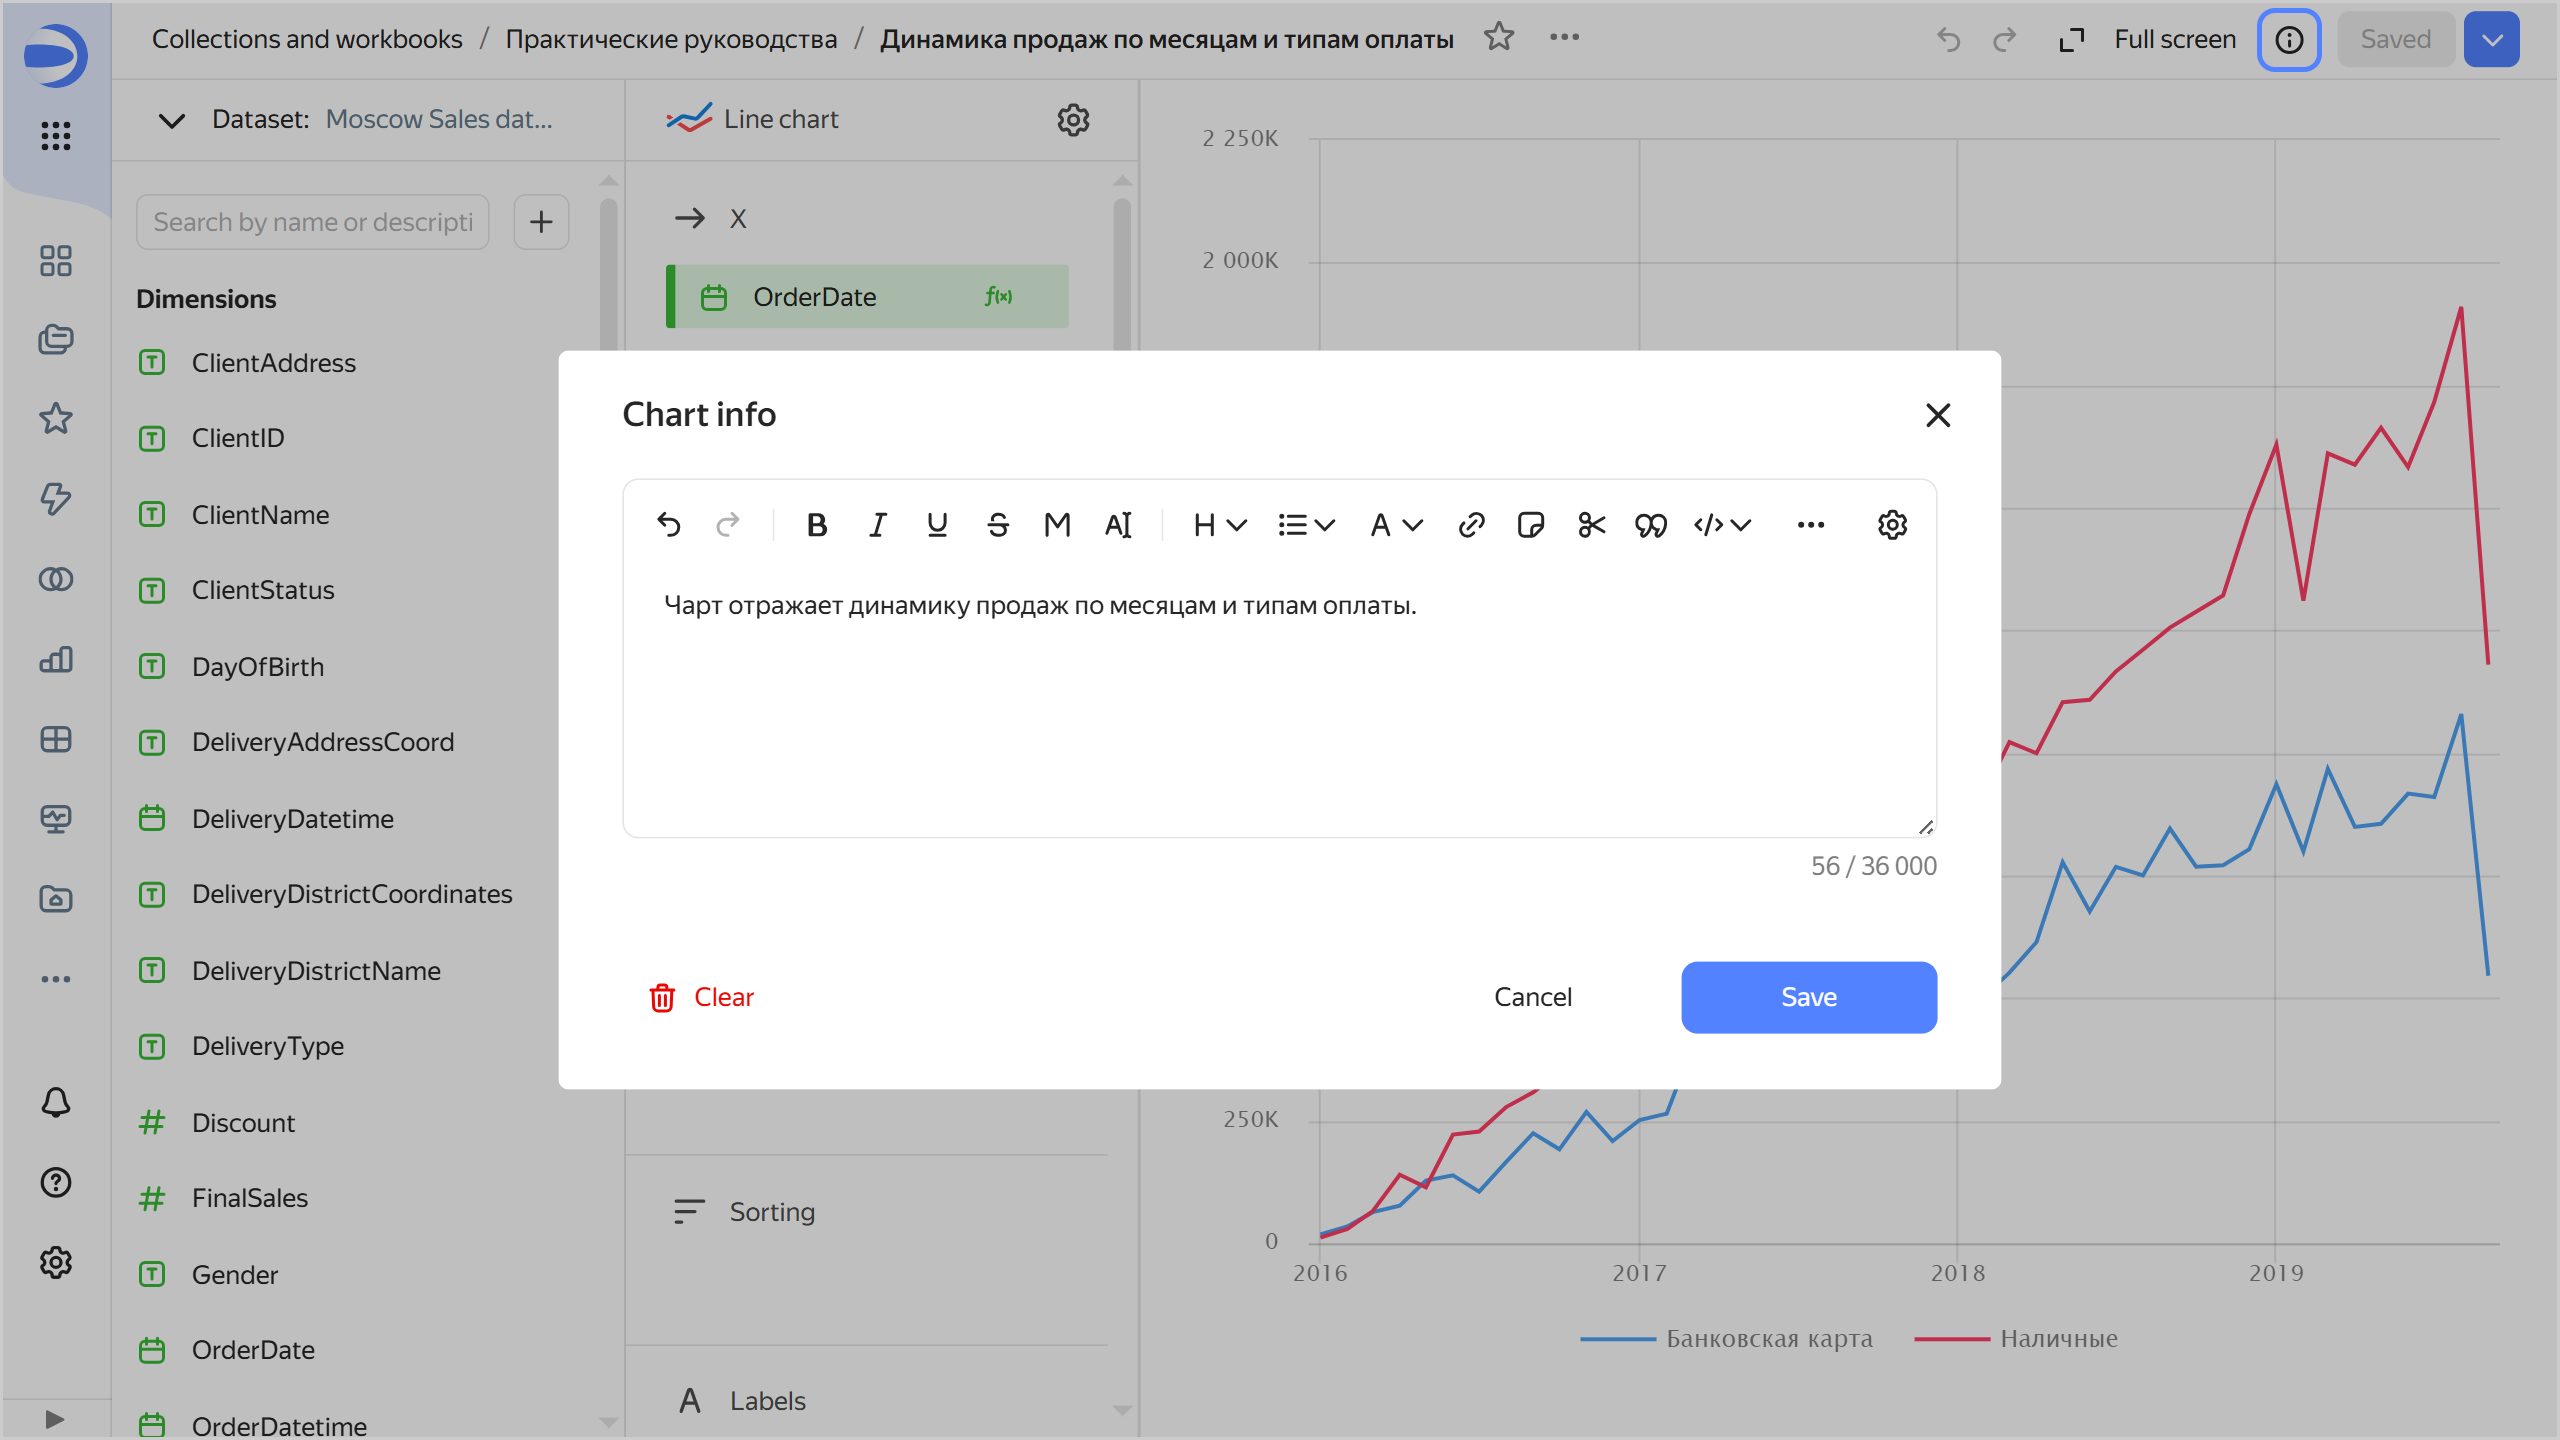
  
     ![add-description](../../_assets/datalens/chart/chart-add-description.png)
 
   - QL chart {#ql}
  
     ![add-description](../../_assets/datalens/chart/ql-chart-add-description.png)

   
   - Editor {#editor}
  
     ![add-description](../../_assets/datalens/chart/editor-chart-add-description.png)


   {% endlist %}

   {% endcut %}

1. In the top-right corner, click **Save**.

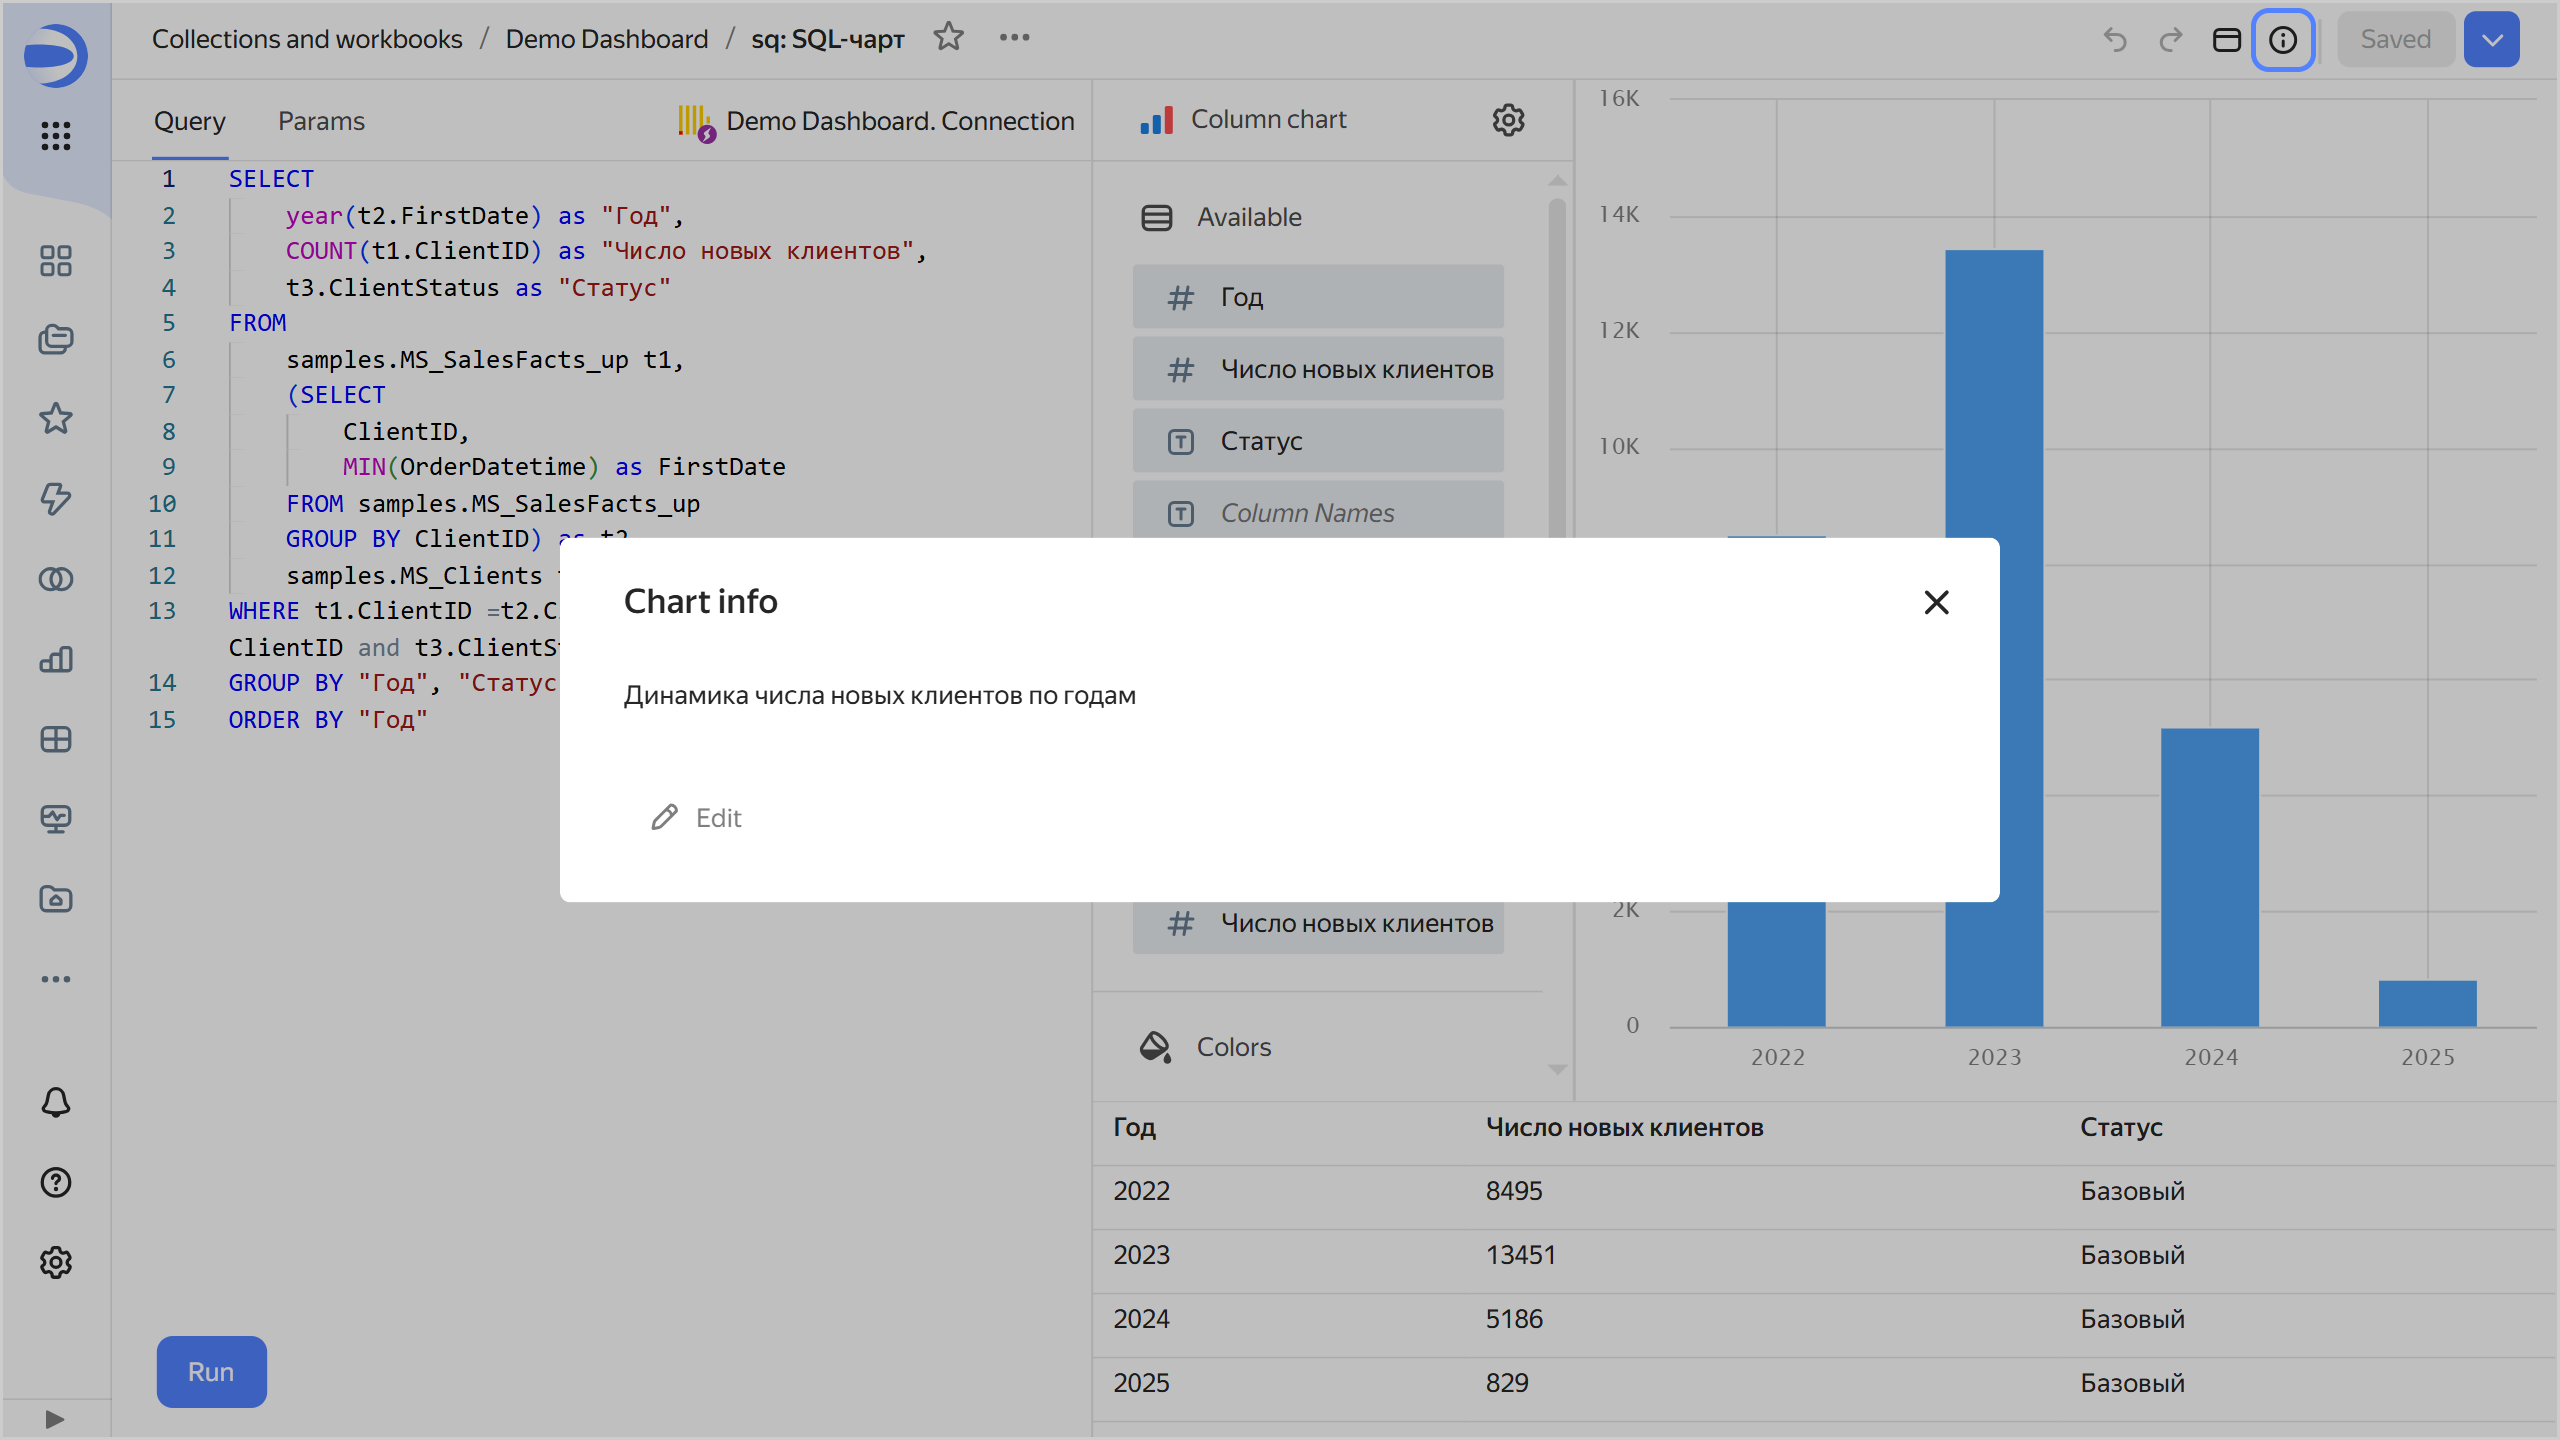
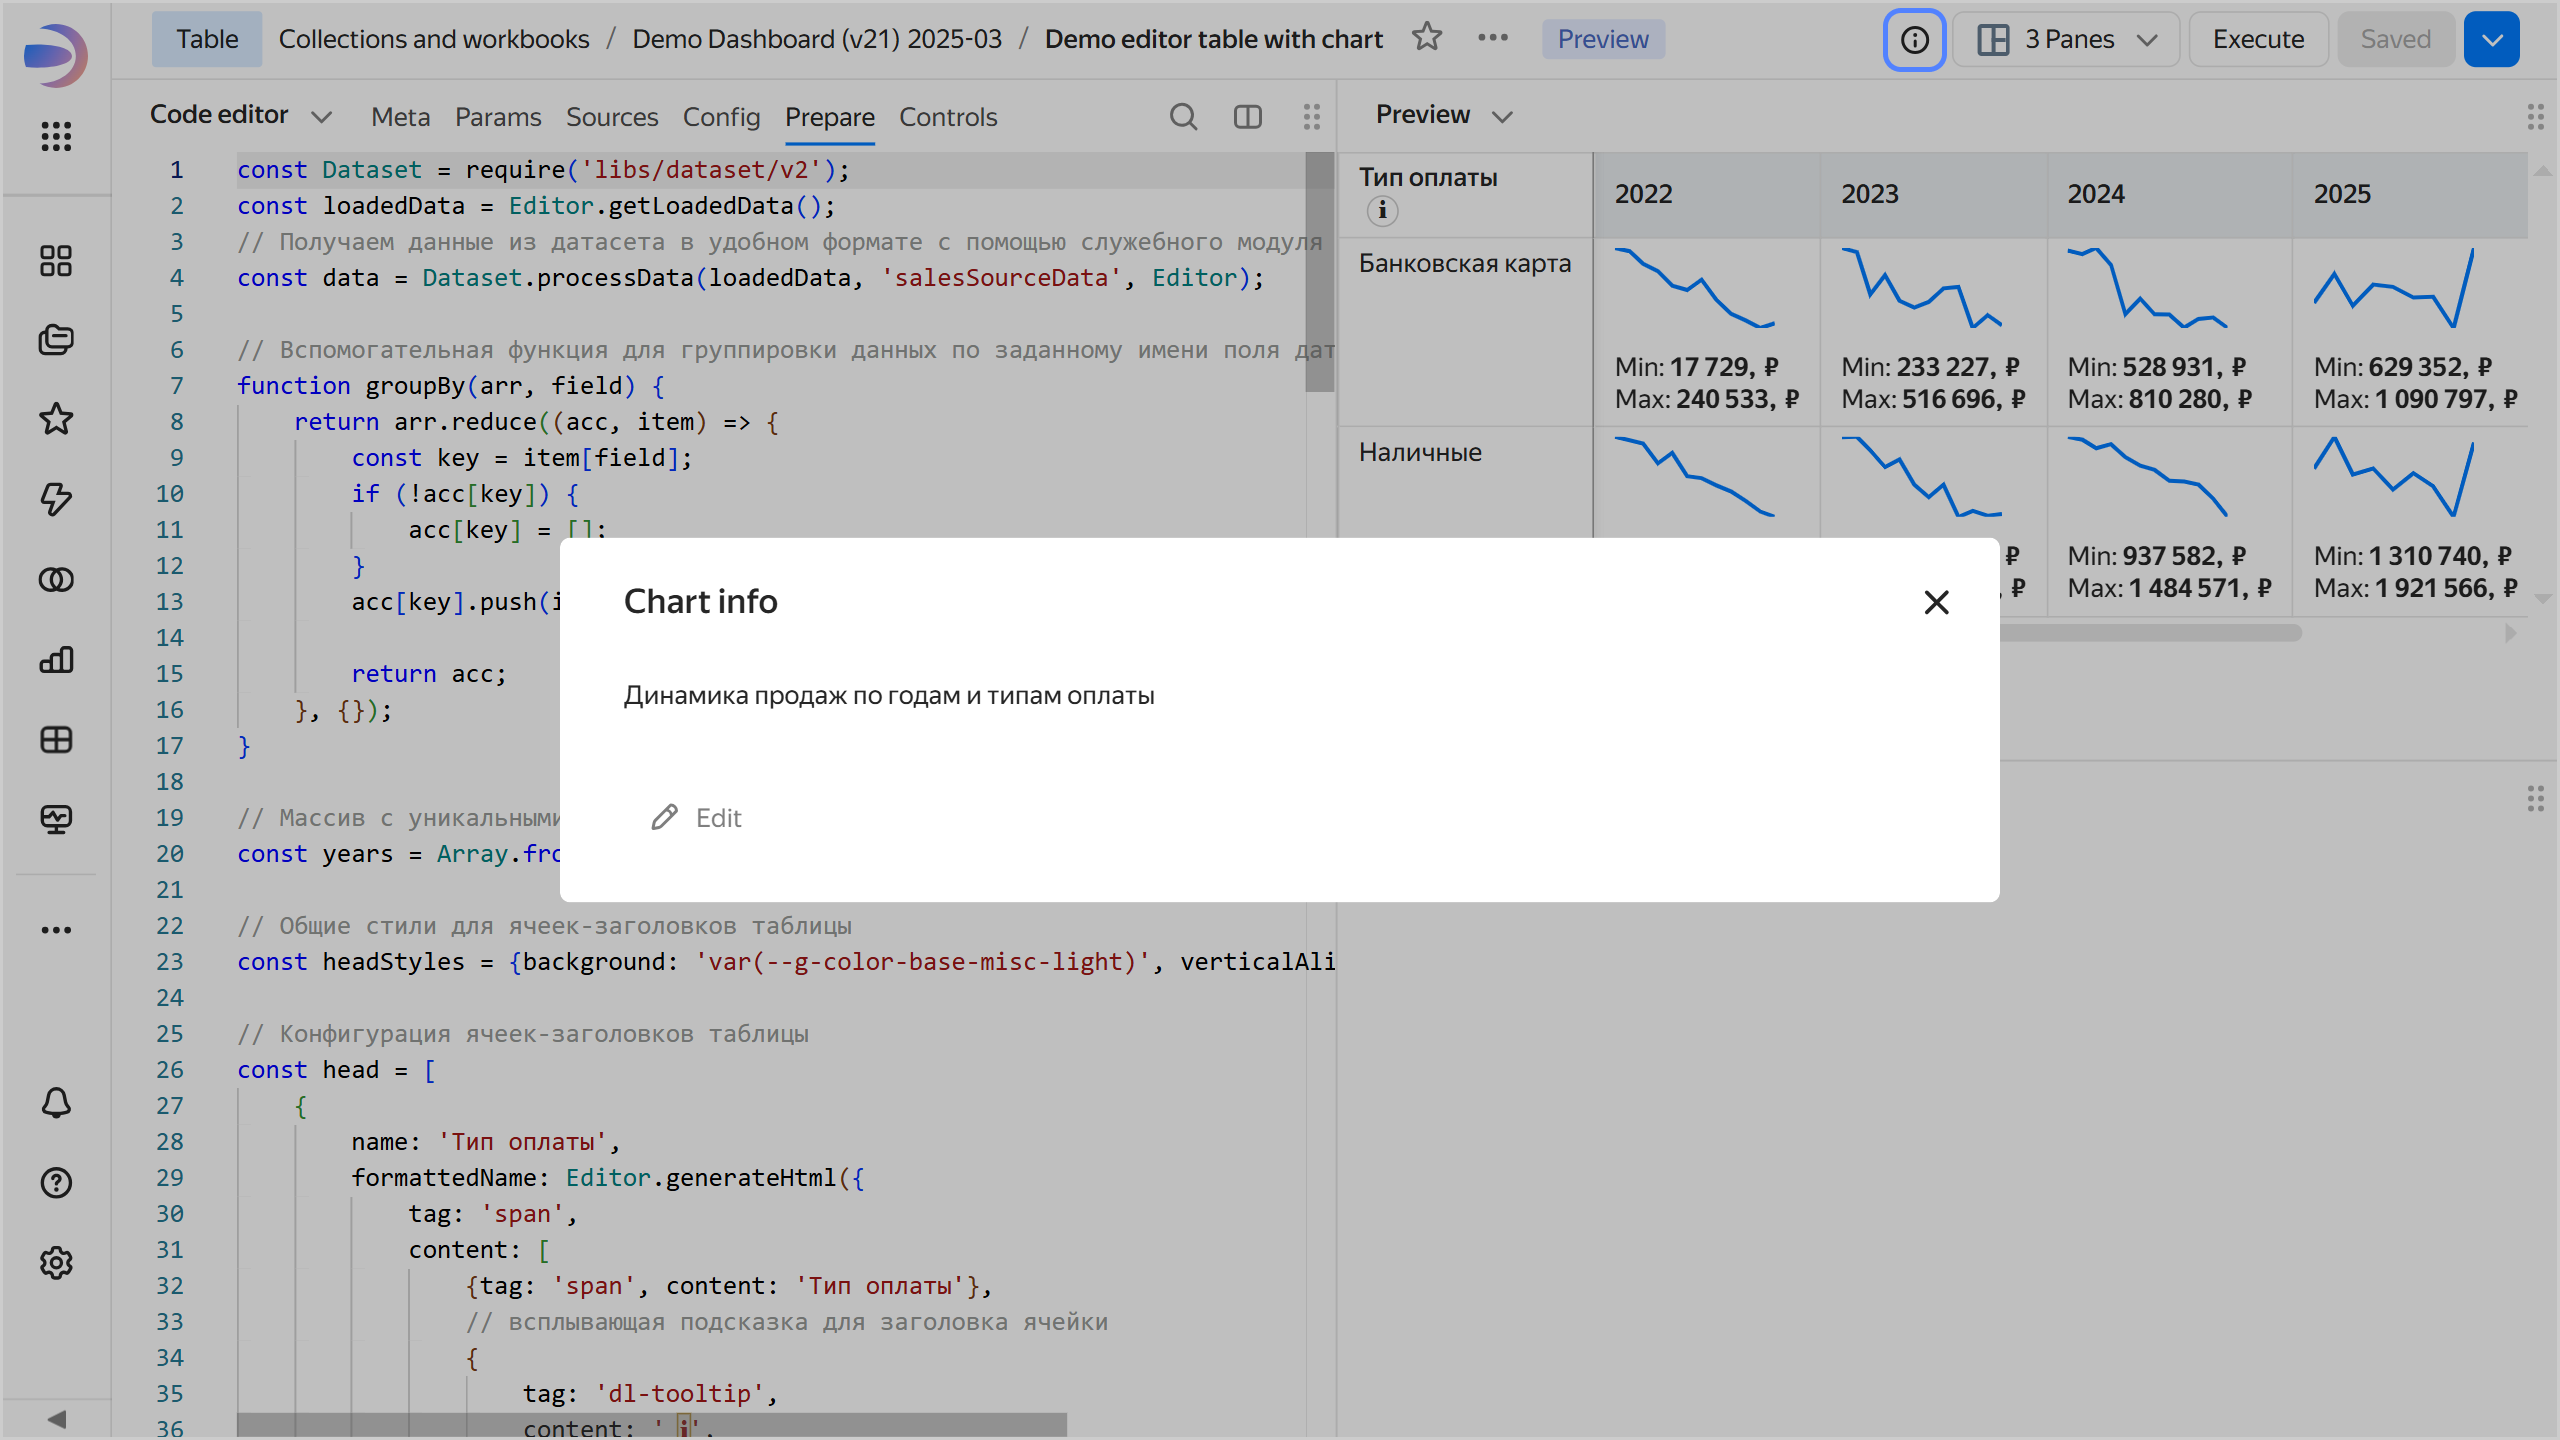
Now all users will see the <!-- diplodoc:svg ![image](../../_assets/console-icons/circle-info.svg) --><svg xmlns="http://www.w3.org/2000/svg" width="16" height="16" fill="none" viewBox="0 0 16 16"><path fill="currentColor" fill-rule="evenodd" d="M8 13.5a5.5 5.5 0 1 0 0-11 5.5 5.5 0 0 0 0 11M8 15A7 7 0 1 0 8 1a7 7 0 0 0 0 14m1-9.5a1 1 0 1 1-2 0 1 1 0 0 1 2 0m-.25 3a.75.75 0 0 0-1.5 0V11a.75.75 0 0 0 1.5 0z" clip-rule="evenodd"/></svg> icon in the top-right corner of the chart. Clicking it will open the **Chart info** window with the information.

{% cut "Viewing chart info" %}

{% list tabs group=charts %}

- Wizard {#wizard}
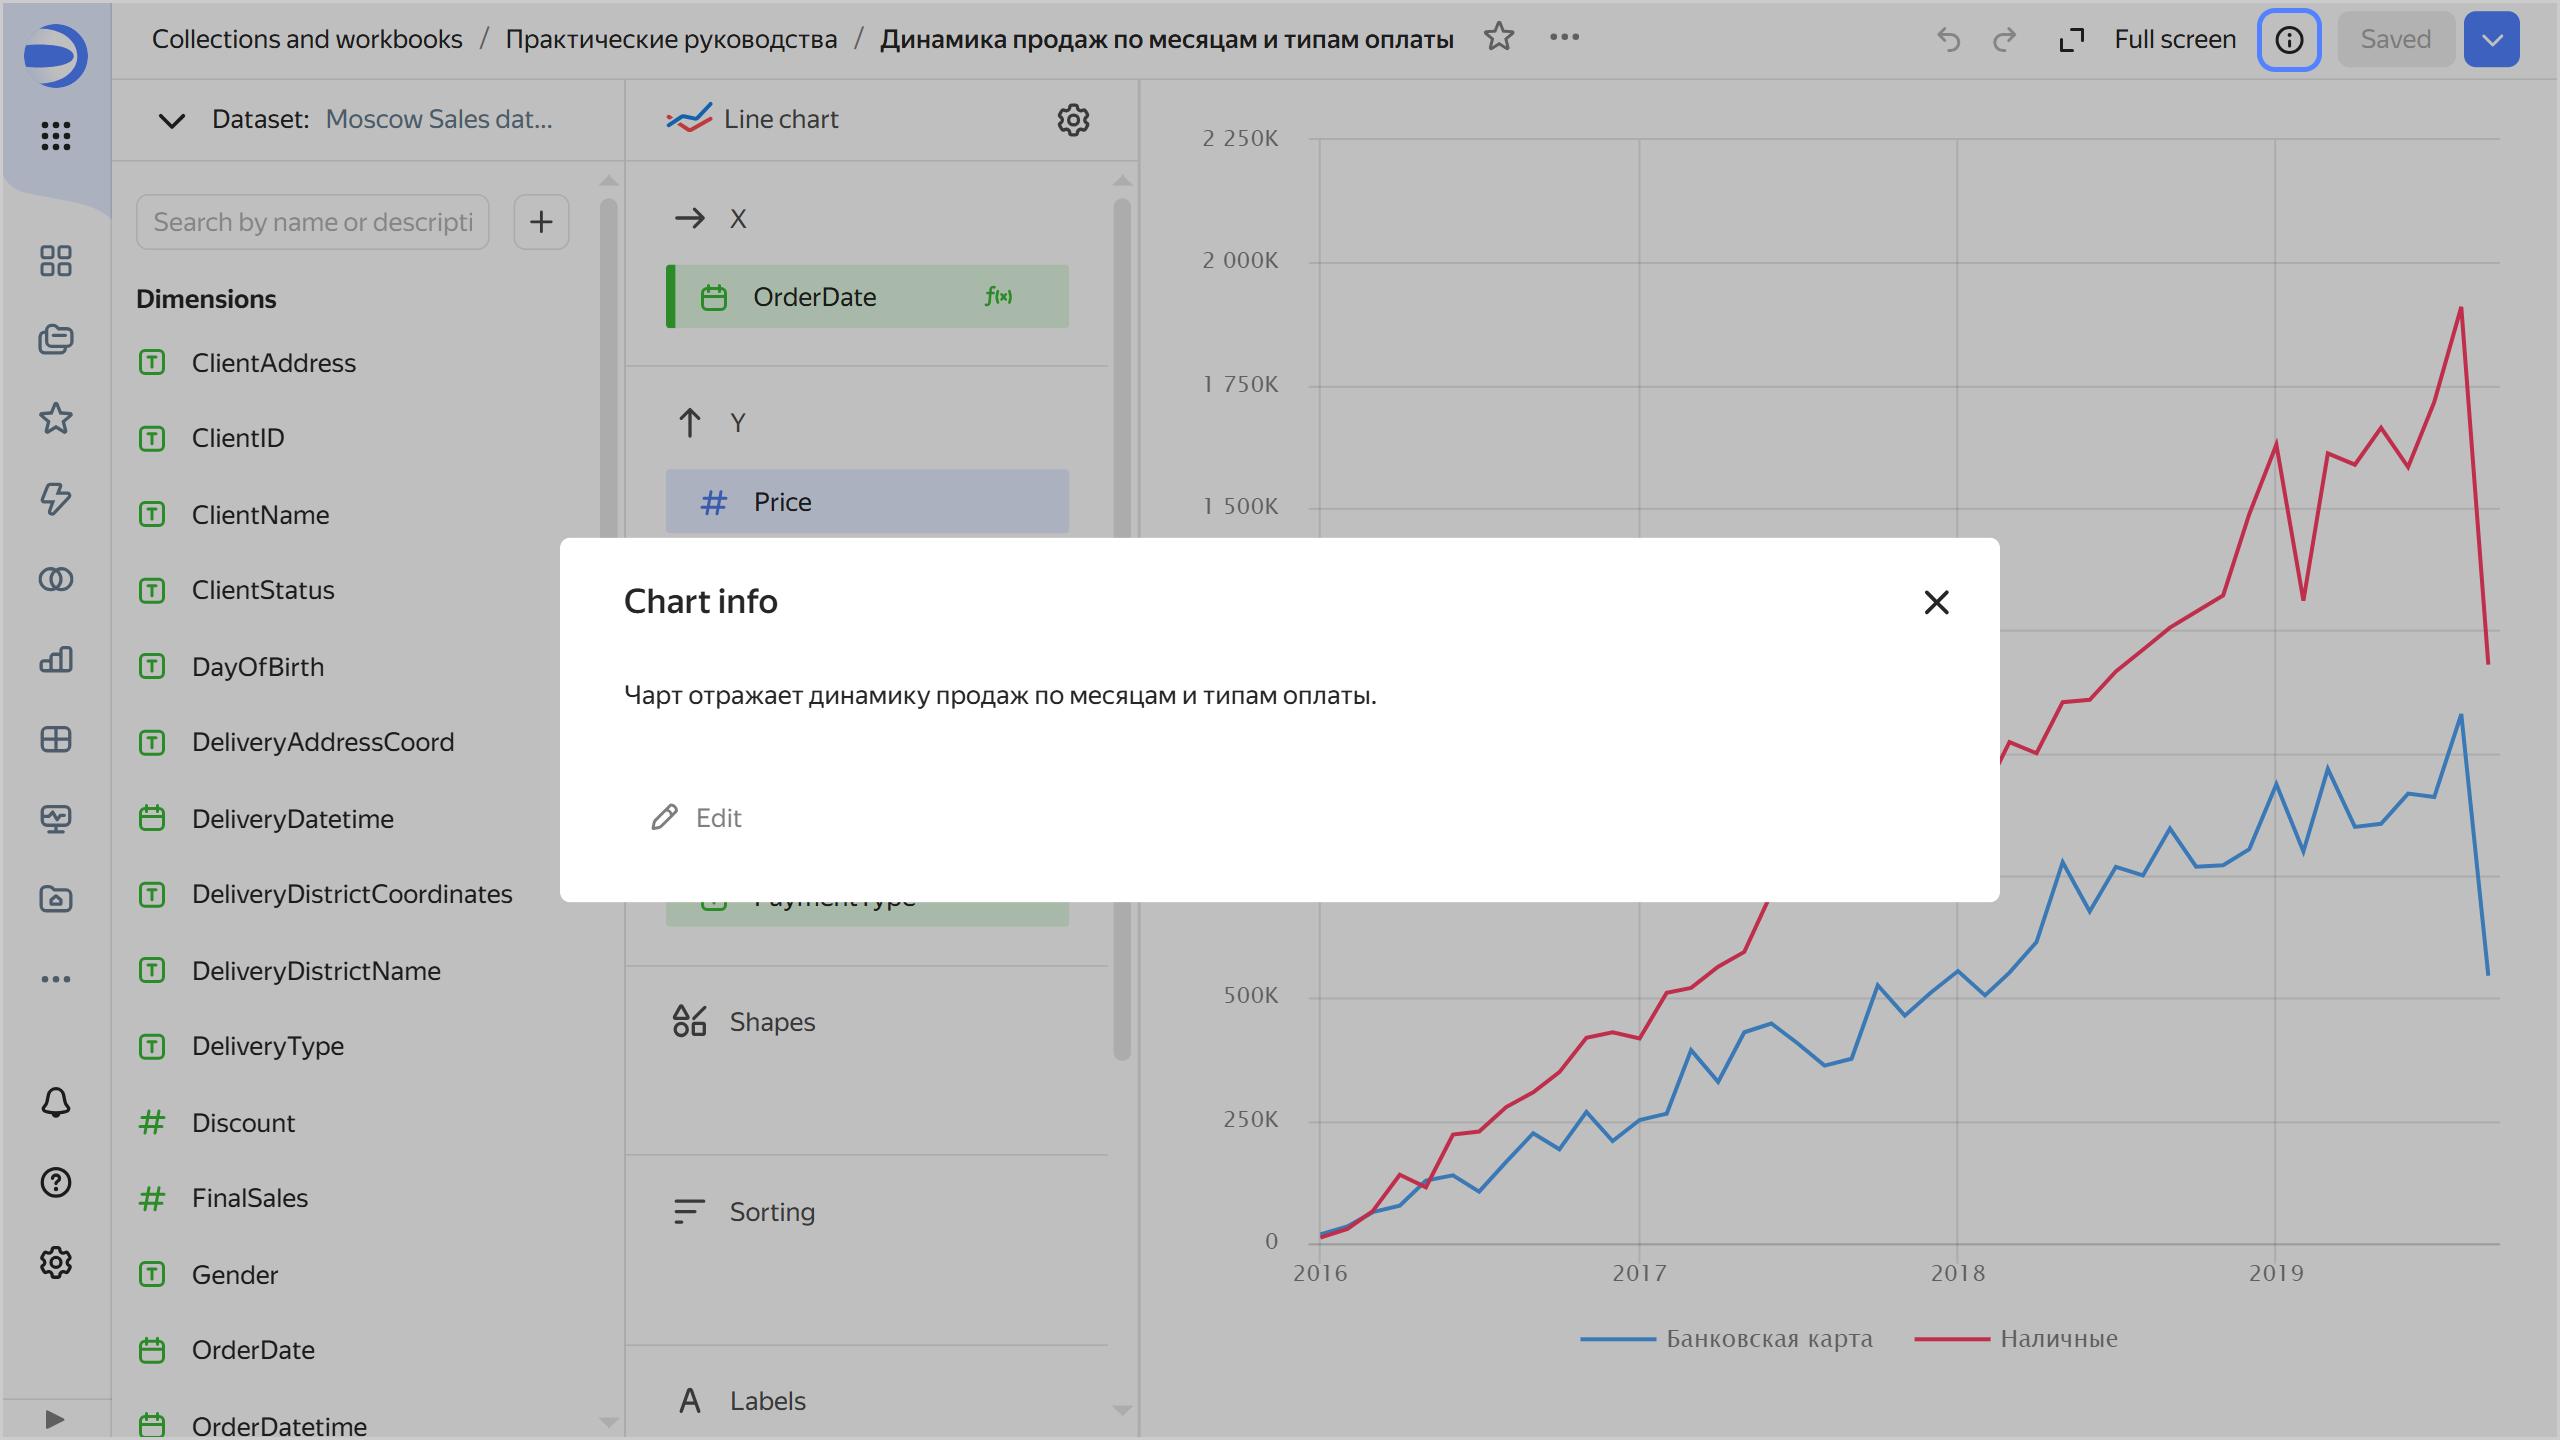
  ![description](../../_assets/datalens/chart/chart-description.png)

- QL chart {#ql}

  ![description](../../_assets/datalens/chart/ql-chart-description.png)


- Editor {#editor}

  ![description](../../_assets/datalens/chart/editor-chart-description.png)


{% endlist %}

{% endcut %}

To remove chart info, save an empty field in the **Chart info** window. Users will no longer see the <!-- diplodoc:svg ![image](../../_assets/console-icons/circle-info.svg) --><svg xmlns="http://www.w3.org/2000/svg" width="16" height="16" fill="none" viewBox="0 0 16 16"><path fill="currentColor" fill-rule="evenodd" d="M8 13.5a5.5 5.5 0 1 0 0-11 5.5 5.5 0 0 0 0 11M8 15A7 7 0 1 0 8 1a7 7 0 0 0 0 14m1-9.5a1 1 0 1 1-2 0 1 1 0 0 1 2 0m-.25 3a.75.75 0 0 0-1.5 0V11a.75.75 0 0 0 1.5 0z" clip-rule="evenodd"/></svg> icon.