---
metadata:
- name: generator
content: Diplodoc Platform v5.63.0
alternate:
- en/operations/dashboard/create-alias
- ru/operations/dashboard/create-alias
- href: en/operations/dashboard/create-alias.md
type: text/markdown
title: Markdown version
csp:
- script-src:
- https://mc.yandex.ru
img-src:
- https://mc.yandex.ru
connect-src:
- https://mc.yandex.ru
- wss://mc.yandex.ru
child-src:
- 'blob:'
- https://mc.yandex.ru
frame-src:
- 'blob:'
- https://mc.yandex.ru
frame-ancestors:
- 'blob:'
- https://mc.yandex.ru
title: How to add an alias in DataLens On-premises
description: Follow this guide to add an alias for widgets in DataLens On-premises.
canonical: en/operations/dashboard/create-alias.html
vcsPath: en/operations/dashboard/create-alias.md
---
# Creating an alias in DataLens On-premises
To add an [alias](../../dashboard/link.md#alias) for a pair of widgets:
1. In the left-hand panel, click **Dashboards** and select the dashboard you need. If you do not have a dashboard, [create one](create.md).
1. At the top of the page, click **Edit**.
1. To the right of the widget to add a link for, click .
1. Select a link type in the list for the widget you are going to link.
1. In the window that opens, for both widgets, select from the list the fields for which you are creating the alias. The fields must be of the same type.
1. Click .
1. Click **Apply**.
{% note warning %}
Please note that you cannot create aliases for fields from the same dataset or fields with the same IDs from different datasets.
{% endnote %}
1. At the bottom of the **Links** window, click **Apply**.
1. In the top-right corner of the dashboard, click **Save**.
{% cut "Example of creating a link" %}
A chart named **tutorial — Line chart** is based on the **tutorial** dataset and a chart named **tutorial 2 — Table** is based on the **tutorial 2** dataset.
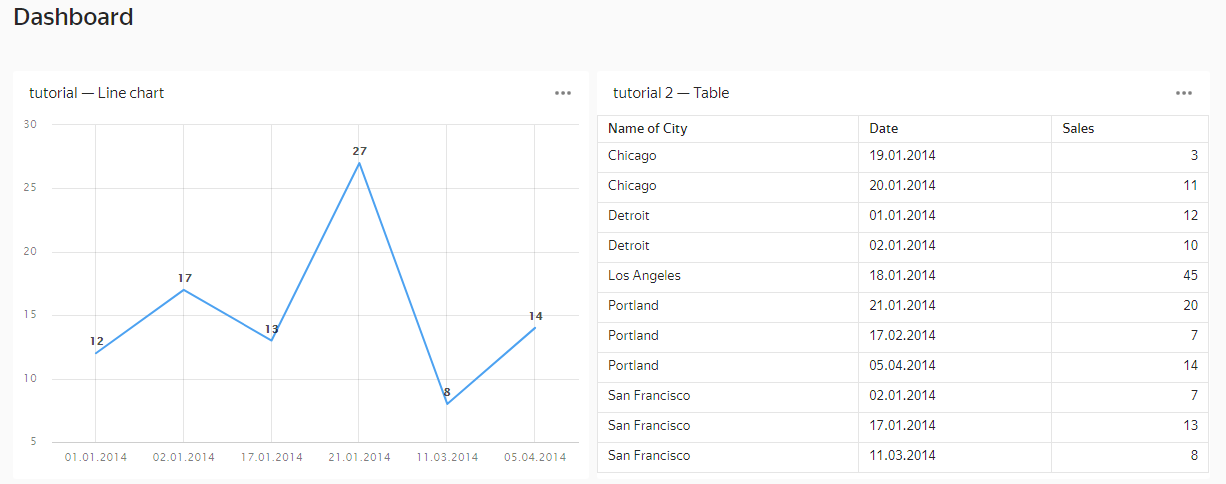
1. Let's add a **tutorial — Date** selector of the **Based on dataset** type to the dashboard. In the selector parameters, select the `tutorial` dataset and the `Date` field. A link between the selector and the **tutorial — Line chart** will be created automatically, since they are based on the same dataset.
1. Let's add a **tutorial 2 — Manual input** selector of the **Manual input** type to the dashboard. In the selector parameters, select the **Calendar** element type and the `Date` field.
1. Let's create a link between the **tutorial 2 — Manual input** selector and the **tutorial 2 — Table** chart using an alias. When creating an alias, select the `Date` field in the selector and the `Date 2` field in the `tutorial 2` dataset.
As a result, the **tutorial — Date** selector will filter the **tutorial — Line chart**, and the **tutorial 2 — Manual input** selector will filter the **tutorial 2 — Table** chart.
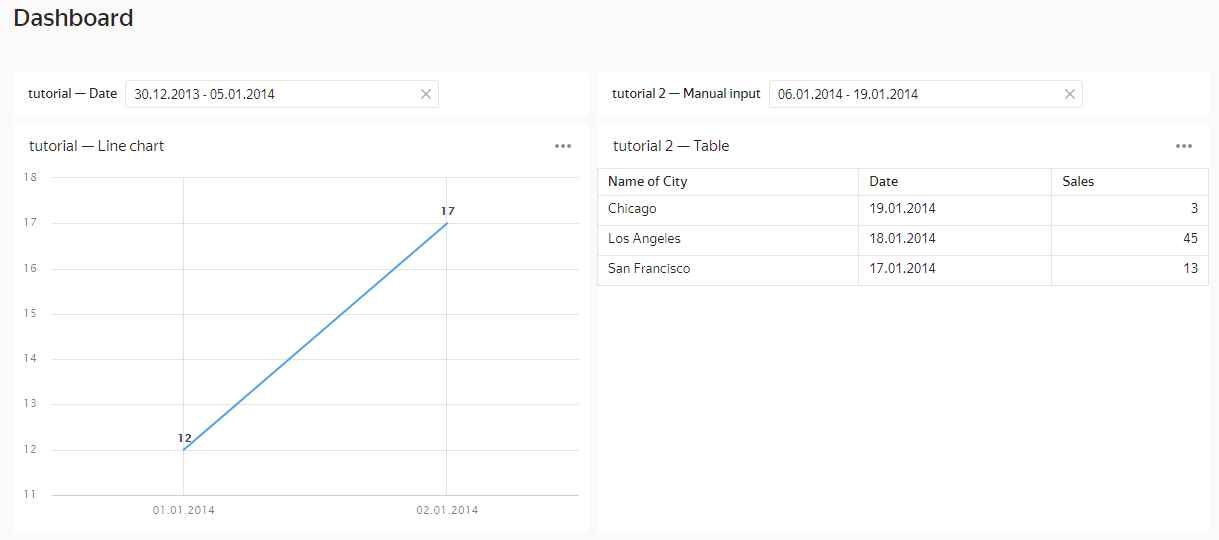
1. Let's create a link between the **tutorial 2 — Manual input** selector and the **tutorial 2 — Line chart** using an alias. When creating an alias, select the `Date` field in the selector and the `Date` field in the `tutorial` dataset.
Creating a link between the **tutorial 2 — Manual input** selector and the **tutorial — Line chart** links the **tutorial 2 — Manual input** and **tutorial — Date** selectors. This happens because the **tutorial — Line chart** and the **tutorial — Date** selector are based on the same dataset. As a result, any selector causes the appropriate values to be set automatically in the other selector and both charts' filters. To unlink the selectors, set their link type to **Not linked**.
{% endcut %}
When adding an alias, make sure the field the selector uses for filtering is included in the dataset used to build the chart. Otherwise, the link will not work.