---
metadata:
  - name: generator
    content: Diplodoc Platform v5.63.0
alternate:
  - en/reports/add-selector
  - ru/reports/add-selector
  - href: en/reports/add-selector.md
    type: text/markdown
    title: Markdown version
csp:
  - script-src:
      - https://mc.yandex.ru
    img-src:
      - https://mc.yandex.ru
    connect-src:
      - https://mc.yandex.ru
      - wss://mc.yandex.ru
    child-src:
      - 'blob:'
      - https://mc.yandex.ru
    frame-src:
      - 'blob:'
      - https://mc.yandex.ru
    frame-ancestors:
      - 'blob:'
      - https://mc.yandex.ru
canonical: en/reports/add-selector.html
title: Selectors in reports
description: Follow this guide to add, set up, or delete selectors in reports.
vcsPath: en/reports/add-selector.md
---

# Selectors in reports

[Selectors](../dashboard/selector.md) are filters that affect the results of queries in the linked widgets.

You can [add](#add-selector), [set up, or delete](#selector-edit) a selector in your report.


Before adding a selector, make sure you have the `Write` or `Admin` access to the report. For more information, see [Setting up access to a workbook](../workbooks-collections/workbooks-operations.md#security).

To start working with [selectors](../dashboard/selector.md):


1. Open the [workbook](../workbooks-collections/index.md) with the report you need and select it.


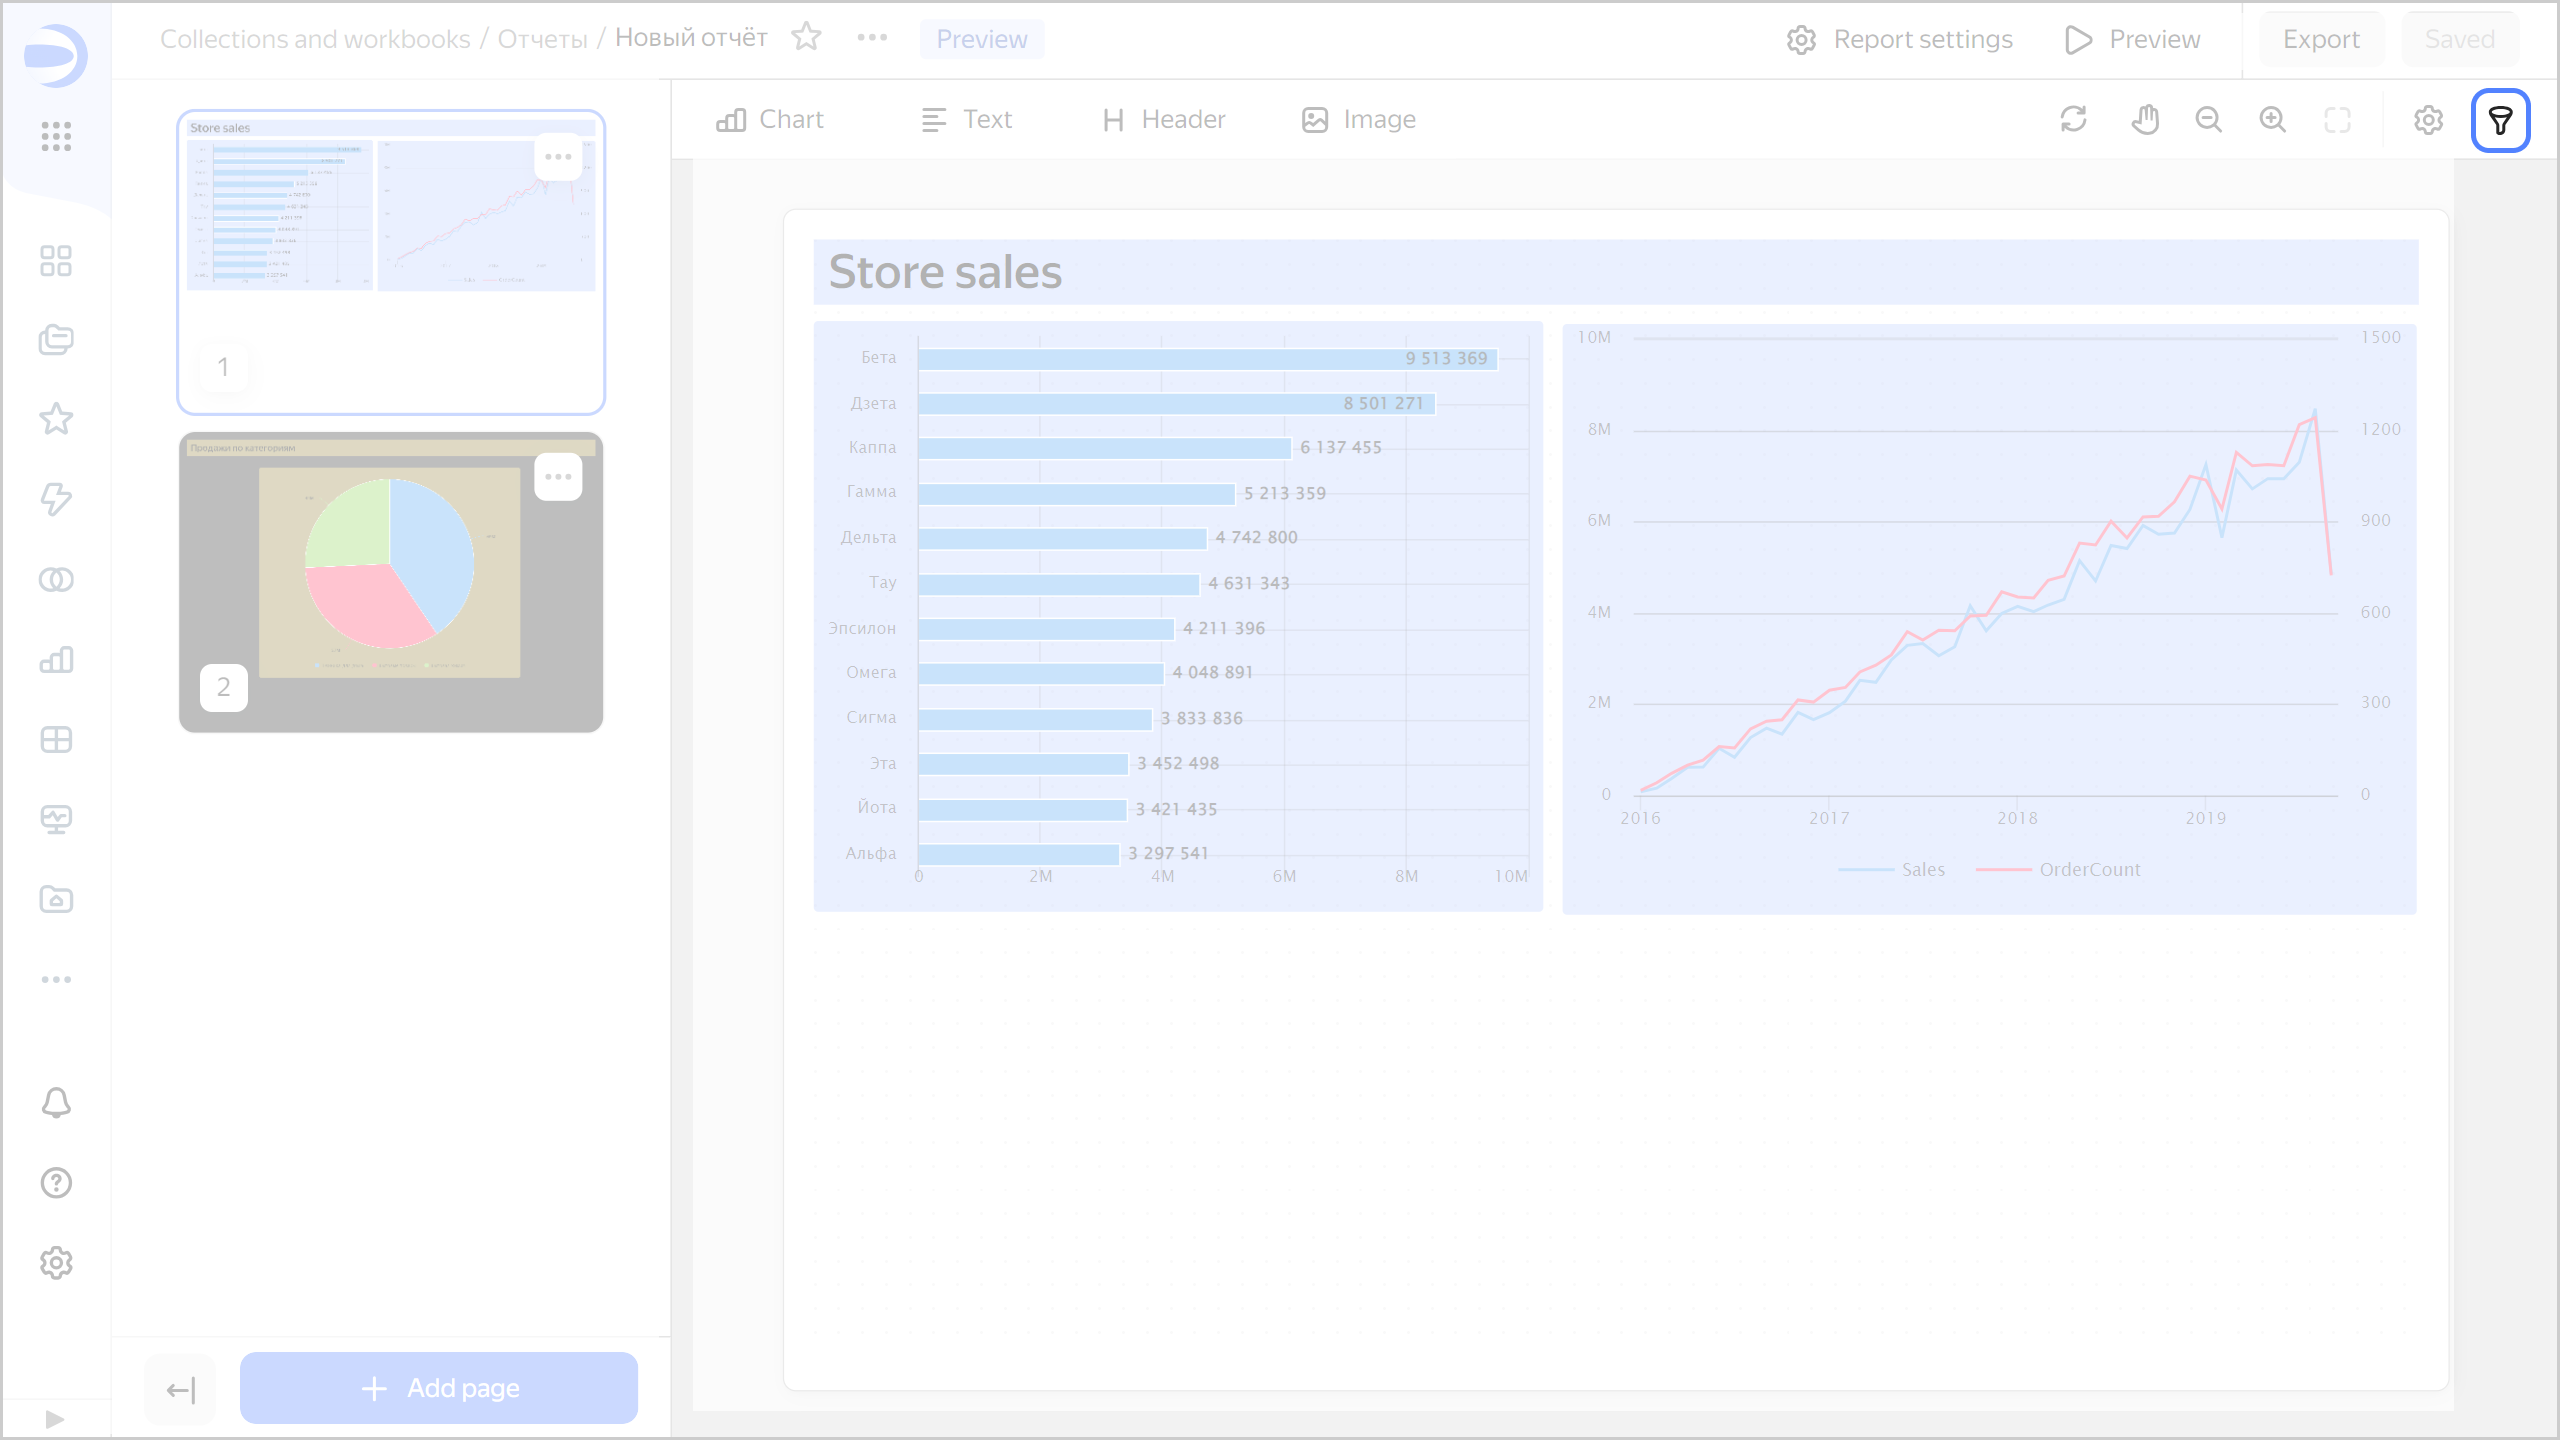
1. At the top right, click <!-- diplodoc:svg ![icon](../_assets/console-icons/funnel.svg) --><svg xmlns="http://www.w3.org/2000/svg" width="16" height="16" fill="none" viewBox="0 0 16 16"><path fill="currentColor" fill-rule="evenodd" d="M12.5 4c0 .174-.071.513-.885.888S9.538 5.5 8 5.5s-2.799-.237-3.615-.612C3.57 4.513 3.5 4.174 3.5 4s.071-.513.885-.888S6.462 2.5 8 2.5s2.799.237 3.615.612c.814.375.885.714.885.888m-1.448 2.66C10.158 6.888 9.115 7 8 7s-2.158-.113-3.052-.34l1.98 2.905c.21.308.322.672.322 1.044v3.37q.088.02.25.021c.422 0 .749-.14.95-.316.185-.162.3-.38.3-.684v-2.39c0-.373.112-.737.322-1.045zM8 1c3.314 0 6 1 6 3a3.24 3.24 0 0 1-.563 1.826l-3.125 4.584a.35.35 0 0 0-.062.2V13c0 1.5-1.25 2.5-2.75 2.5s-1.75-1-1.75-1v-3.89a.35.35 0 0 0-.061-.2L2.563 5.826A3.24 3.24 0 0 1 2 4c0-2 2.686-3 6-3m-.88 12.936q-.015-.008-.013-.01z" clip-rule="evenodd"/></svg>.

   ![report-filter](../_assets/datalens/report/report-filter.png)

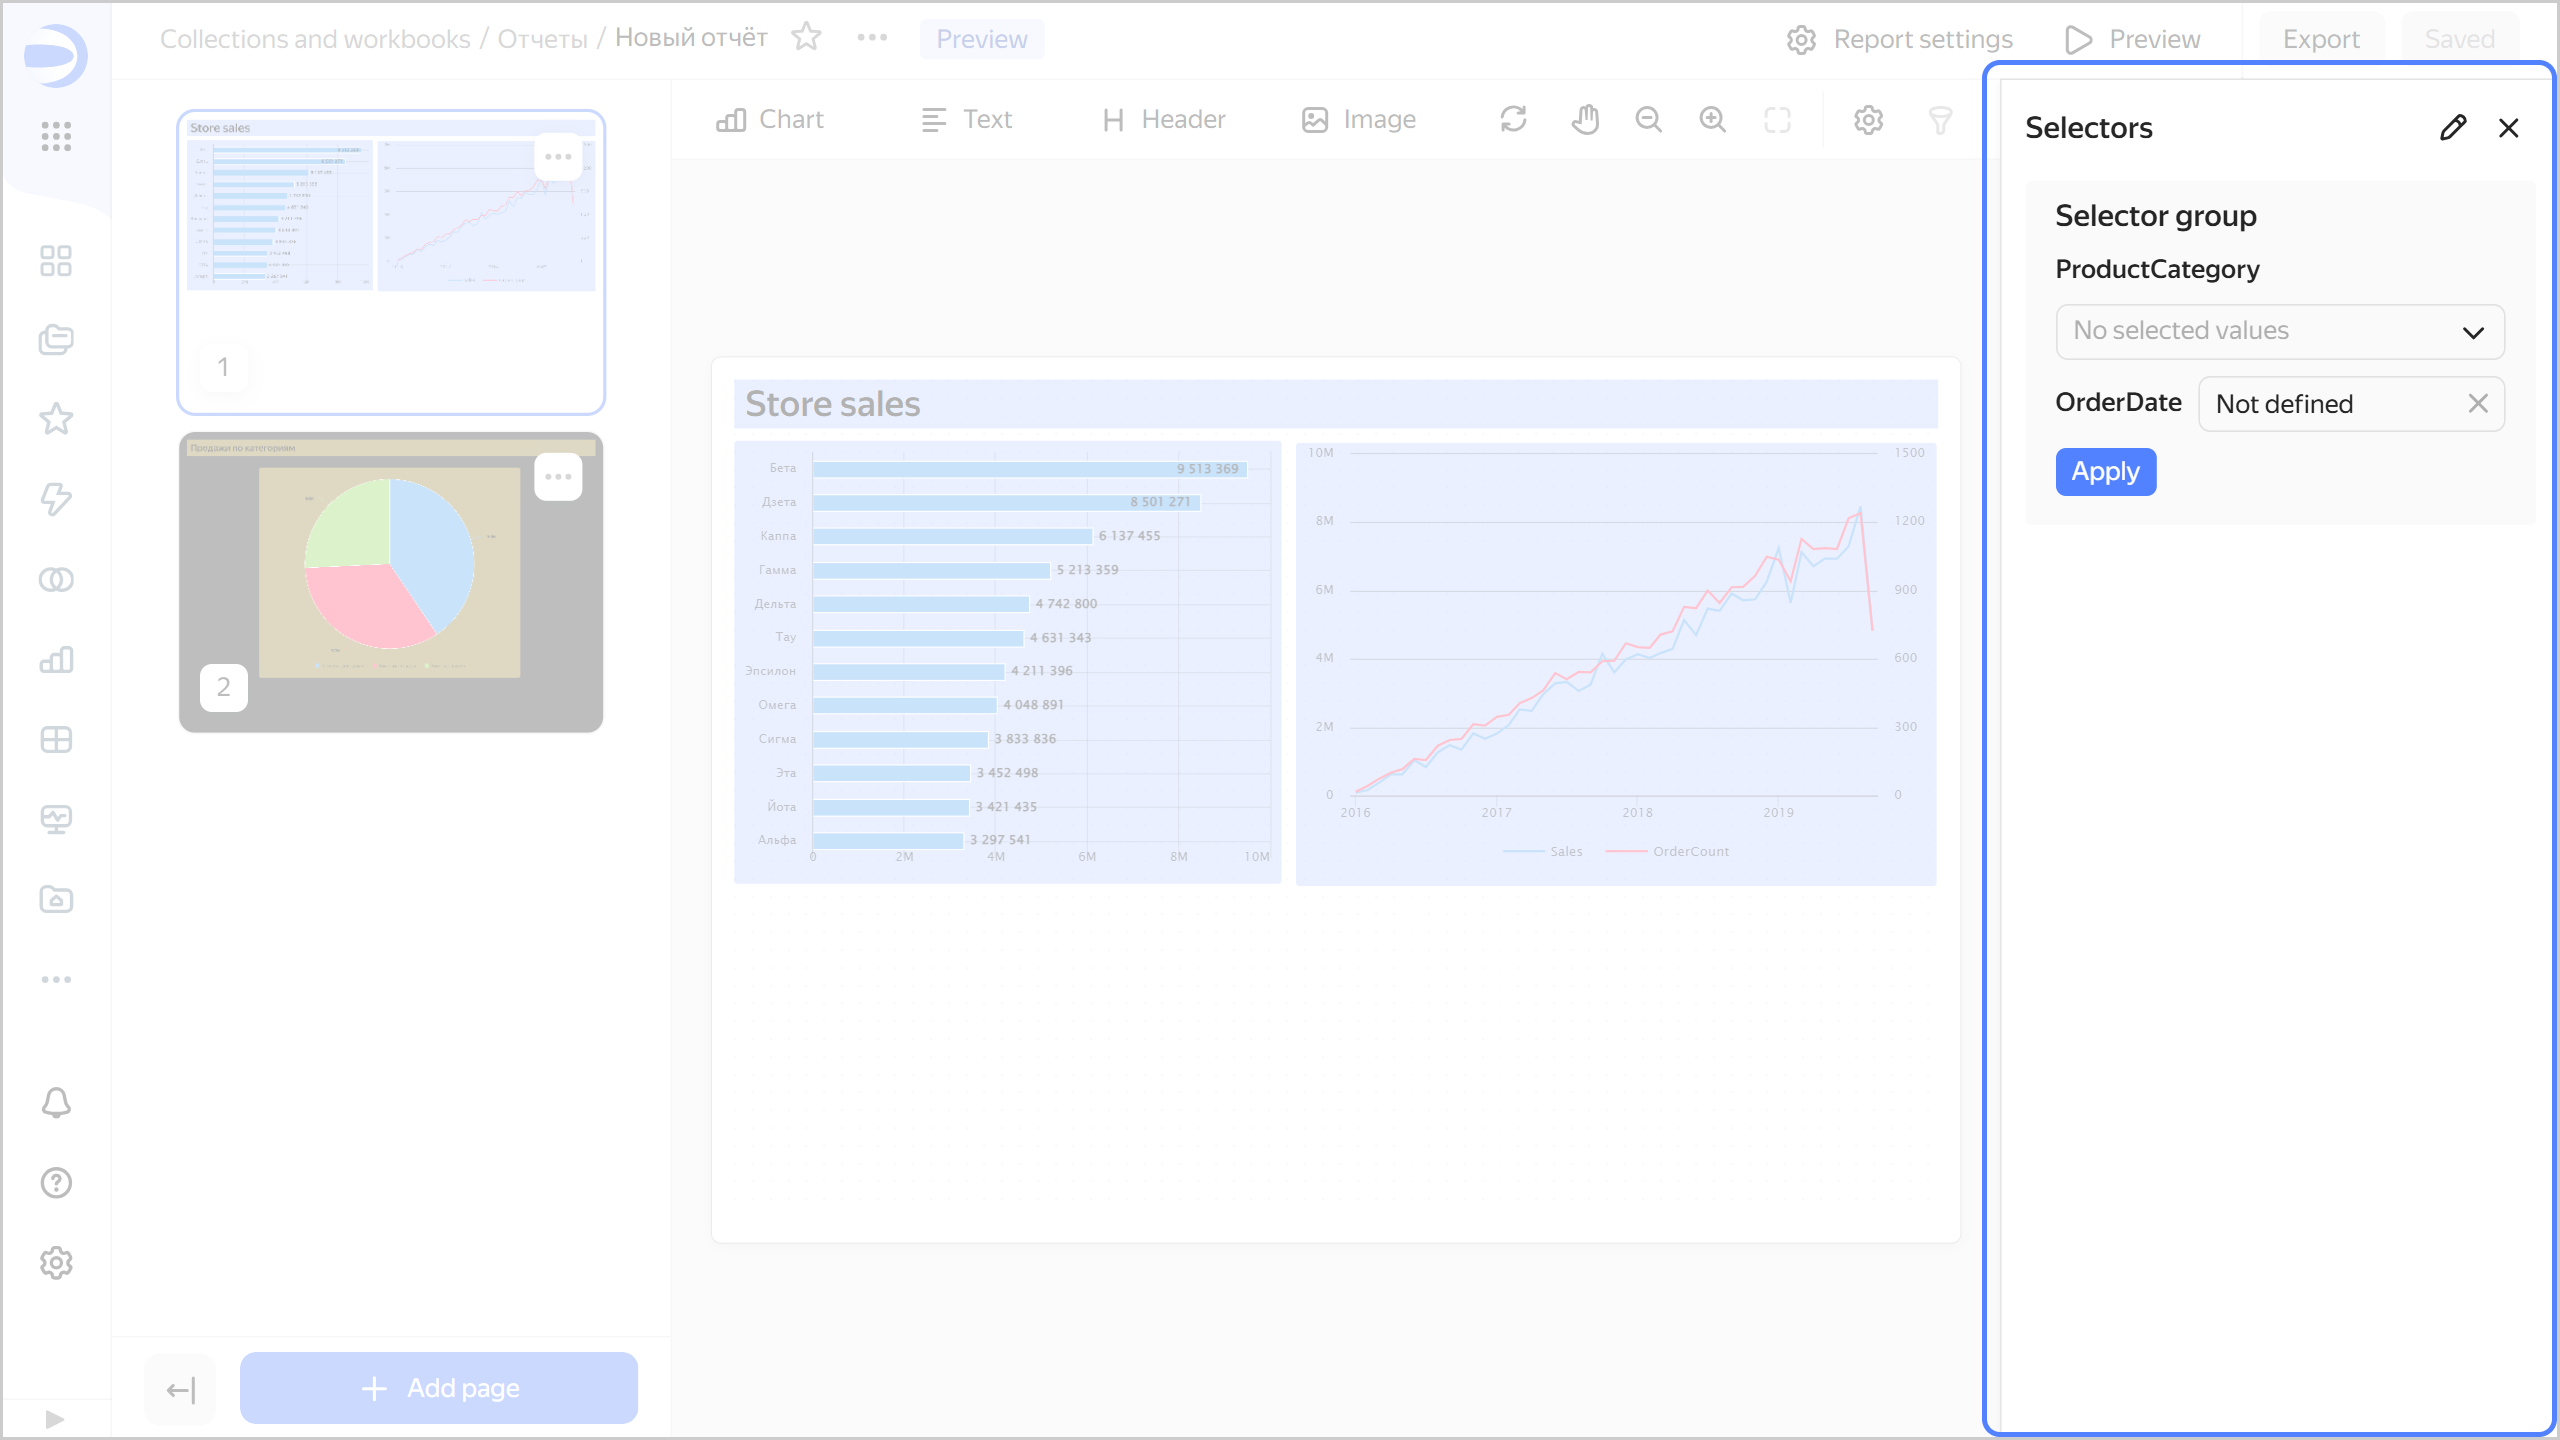
   The **Selectors** window will open on the right:

   * To enter edit mode, click <!-- diplodoc:svg ![icon](../_assets/console-icons/pencil.svg) --><svg xmlns="http://www.w3.org/2000/svg" width="16" height="16" fill="none" viewBox="0 0 16 16"><path fill="currentColor" fill-rule="evenodd" d="M11.423 1A3.577 3.577 0 0 1 15 4.577c0 .27-.108.53-.3.722l-.528.529-1.971 1.971-5.059 5.059a3 3 0 0 1-1.533.82l-2.638.528a1 1 0 0 1-1.177-1.177l.528-2.638a3 3 0 0 1 .82-1.533l5.059-5.059 2.5-2.5c.191-.191.451-.299.722-.299m-2.31 4.009-4.91 4.91a1.5 1.5 0 0 0-.41.766l-.38 1.903 1.902-.38a1.5 1.5 0 0 0 .767-.41l4.91-4.91a2.08 2.08 0 0 0-1.88-1.88m3.098.658a3.6 3.6 0 0 0-1.878-1.879l1.28-1.28c.995.09 1.788.884 1.878 1.88z" clip-rule="evenodd"/></svg>.
   * To get back to filter mode, click <!-- diplodoc:svg ![icon](../_assets/console-icons/check.svg) --><svg xmlns="http://www.w3.org/2000/svg" width="16" height="16" fill="none" viewBox="0 0 16 16"><path fill="currentColor" fill-rule="evenodd" d="M13.488 3.43a.75.75 0 0 1 .081 1.058l-6 7a.75.75 0 0 1-1.1.042l-3.5-3.5A.75.75 0 0 1 4.03 6.97l2.928 2.927 5.473-6.385a.75.75 0 0 1 1.057-.081" clip-rule="evenodd"/></svg>.
   * To hide the **Selectors** window, click <!-- diplodoc:svg ![icon](../_assets/console-icons/xmark.svg) --><svg xmlns="http://www.w3.org/2000/svg" width="16" height="16" fill="none" viewBox="0 0 16 16"><path fill="currentColor" fill-rule="evenodd" d="M3.47 3.47a.75.75 0 0 1 1.06 0L8 6.94l3.47-3.47a.75.75 0 1 1 1.06 1.06L9.06 8l3.47 3.47a.75.75 0 1 1-1.06 1.06L8 9.06l-3.47 3.47a.75.75 0 0 1-1.06-1.06L6.94 8 3.47 4.53a.75.75 0 0 1 0-1.06" clip-rule="evenodd"/></svg>.

   {% cut "Selectors in filter mode" %}

   ![report-selector-open](../_assets/datalens/report/report-selector-open.png)

   {% endcut %}

   {% cut "Selectors in edit mode" %}
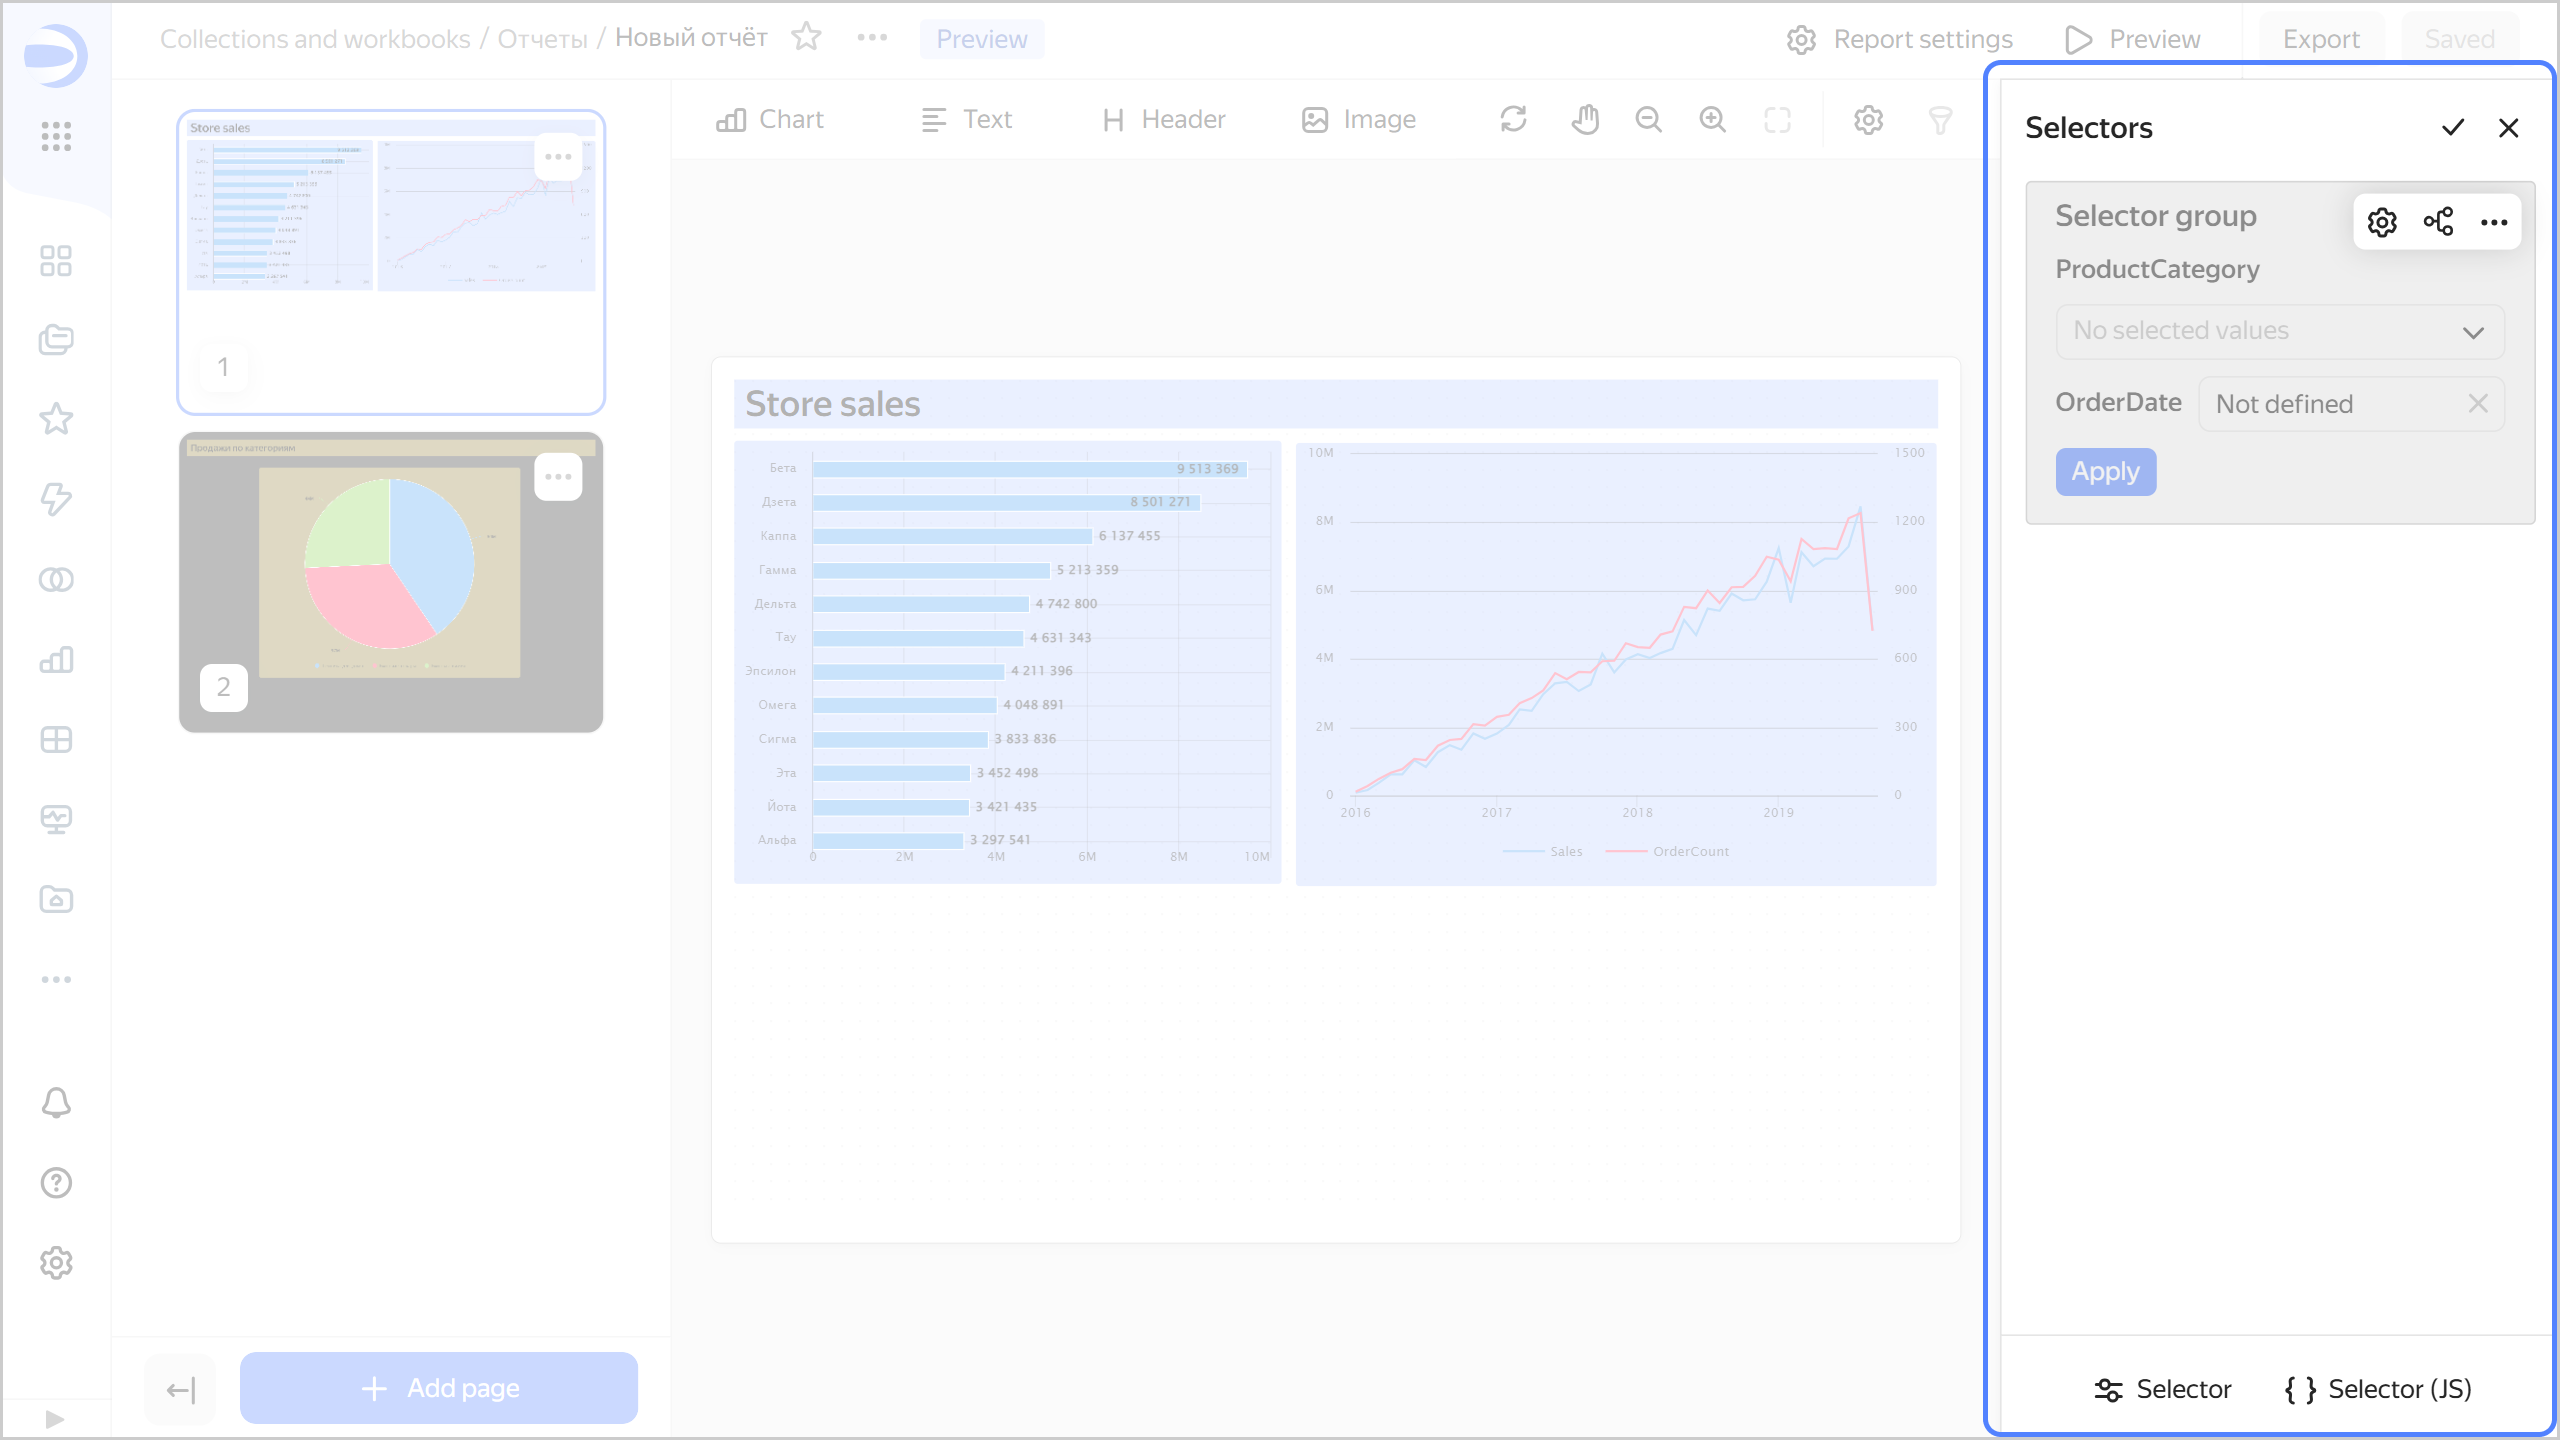
   ![report-selector-edit](../_assets/datalens/report/report-selector-edit.png)

   {% endcut %}

## Adding a selector {#add-selector}

To add a [selector](../dashboard/selector.md) to a report:

1. Open the **Selectors** window. To do this, click <!-- diplodoc:svg ![icon](../_assets/console-icons/funnel.svg) --><svg xmlns="http://www.w3.org/2000/svg" width="16" height="16" fill="none" viewBox="0 0 16 16"><path fill="currentColor" fill-rule="evenodd" d="M12.5 4c0 .174-.071.513-.885.888S9.538 5.5 8 5.5s-2.799-.237-3.615-.612C3.57 4.513 3.5 4.174 3.5 4s.071-.513.885-.888S6.462 2.5 8 2.5s2.799.237 3.615.612c.814.375.885.714.885.888m-1.448 2.66C10.158 6.888 9.115 7 8 7s-2.158-.113-3.052-.34l1.98 2.905c.21.308.322.672.322 1.044v3.37q.088.02.25.021c.422 0 .749-.14.95-.316.185-.162.3-.38.3-.684v-2.39c0-.373.112-.737.322-1.045zM8 1c3.314 0 6 1 6 3a3.24 3.24 0 0 1-.563 1.826l-3.125 4.584a.35.35 0 0 0-.062.2V13c0 1.5-1.25 2.5-2.75 2.5s-1.75-1-1.75-1v-3.89a.35.35 0 0 0-.061-.2L2.563 5.826A3.24 3.24 0 0 1 2 4c0-2 2.686-3 6-3m-.88 12.936q-.015-.008-.013-.01z" clip-rule="evenodd"/></svg> at the top right.
   If your report already has selectors, switch to edit mode. To do this, click <!-- diplodoc:svg ![icon](../_assets/console-icons/pencil.svg) --><svg xmlns="http://www.w3.org/2000/svg" width="16" height="16" fill="none" viewBox="0 0 16 16"><path fill="currentColor" fill-rule="evenodd" d="M11.423 1A3.577 3.577 0 0 1 15 4.577c0 .27-.108.53-.3.722l-.528.529-1.971 1.971-5.059 5.059a3 3 0 0 1-1.533.82l-2.638.528a1 1 0 0 1-1.177-1.177l.528-2.638a3 3 0 0 1 .82-1.533l5.059-5.059 2.5-2.5c.191-.191.451-.299.722-.299m-2.31 4.009-4.91 4.91a1.5 1.5 0 0 0-.41.766l-.38 1.903 1.902-.38a1.5 1.5 0 0 0 .767-.41l4.91-4.91a2.08 2.08 0 0 0-1.88-1.88m3.098.658a3.6 3.6 0 0 0-1.878-1.879l1.28-1.28c.995.09 1.788.884 1.878 1.88z" clip-rule="evenodd"/></svg>.
1. From the panel below, drag the **Selector** widget to the **Selectors** section.
   
   {% cut "Adding a selector" %}
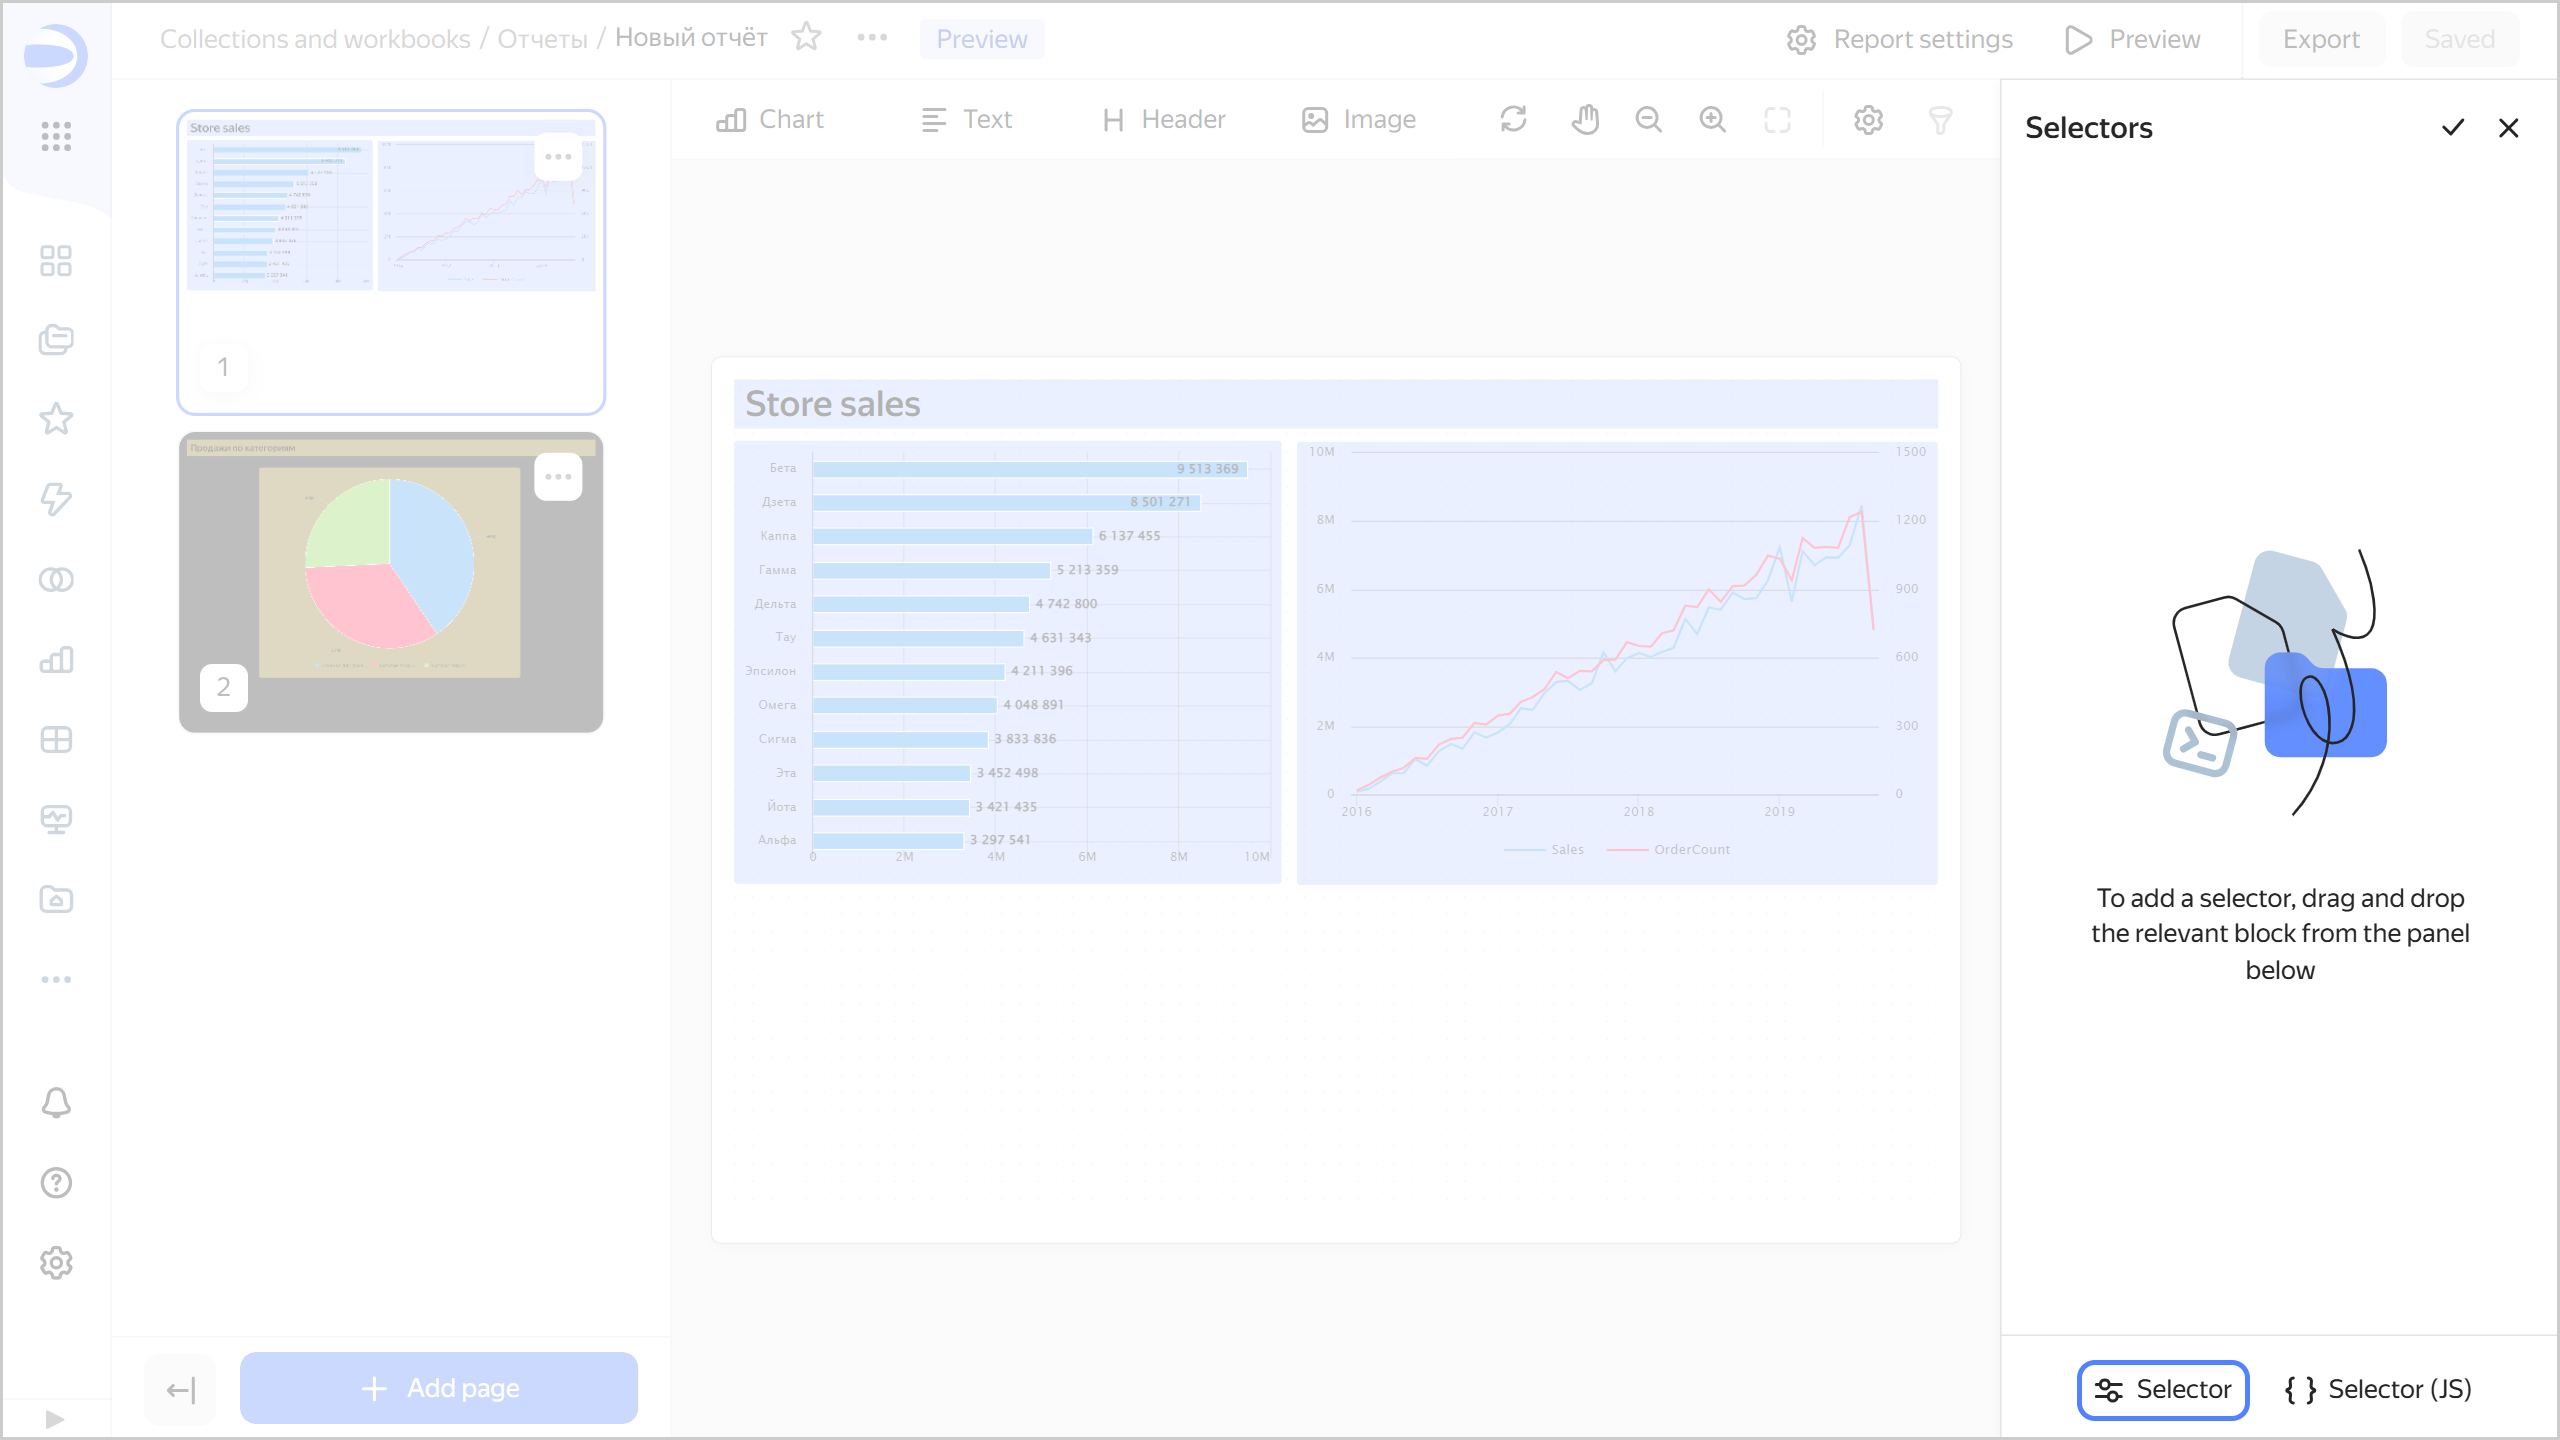
     
   ![image](../_assets/datalens/report/report-selector-add.png)
     
   {% endcut %}

1. Under **Selector settings** choose the source and specify the selector parameters:

   {% list tabs %}

   - Based on a dataset

     * **Dataset**: Dataset with data for the selector. You can choose a dataset from the list of objects or provide a link. This is a required field.
     * **Field**: Dataset field with selector values. It can be either a dimension or a measure. For more information, see [Data fields](../dataset/data-model.md#field). This is a required field.
     * **Selector type**: Drop-down list, input field, calendar, or checkbox.

       {% note info %}

       * **Calendar** is only available for fields of the `Date` or `Date and time` type.
       * **Checkbox** is only available for fields of the `Boolean` type.
       * Measure selectors can only have the **Input field** type.

       {% endnote %}

     * **Operation**: Comparison operation for the selector to filter the chart values (e.g., **Equal to**, **Greater than**, or **Less than**). If the field is left blank, the selector will filter by the **Equal to** operation by default. The list of available operations depends on the field type. Do not specify an operation if the selector filters the QL chart.
     * **Multiple choice**: Allows choosing several values in the selector. It is only available for the **List** selector type.
     * **Range**: Allows setting a time interval in the selector. It is only available for the **Calendar** selector type.
     * **Required field**: Sets the selector value as a required parameter. When enabled, `*` is appended to the selector name. It is not available for the **Checkbox** selector type.
     * **Default value**: Applied initially when you open the report. This is a required field if the **Required field** option is enabled.

     * **Header**: To choose the selector for linking with other widgets. By default, when you add a selector, the header text is substituted from the field title in the [dataset](../dataset/index.md). This is a required field.
       
       Select the header location below: `Left` (default), `Top`, or `Hidden` to hide it from the report selector settings window. It is not available for the **Checkbox** selector type.

     * **Inner title**: Allows specifying text inside a selector. For example, you can use it to display an operation inside a selector. It is not available for the **Checkbox** selector type.
     * **Coloring**: Allows you to highlight important selectors. It is not available for the **Checkbox** selector type.
     * **Tooltip**: This option allows adding a text comment to a selector. By default, with this option enabled, the tooltip text is taken from the field description in the dataset. You can edit the tooltip text using the visual editor or [Markdown](../dashboard/markdown.md). Changing the field description in the dataset will not automatically update the text.

       When the option is enabled, you will see the <!-- diplodoc:svg ![image](../_assets/console-icons/circle-question.svg) --><svg xmlns="http://www.w3.org/2000/svg" width="16" height="16" fill="none" viewBox="0 0 16 16"><path fill="currentColor" fill-rule="evenodd" d="M8 13.5a5.5 5.5 0 1 0 0-11 5.5 5.5 0 0 0 0 11M8 15A7 7 0 1 0 8 1a7 7 0 0 0 0 14M6.44 4.54c.43-.354.994-.565 1.56-.565 1.217 0 2.34.82 2.34 2.14 0 .377-.078.745-.298 1.1-.208.339-.513.614-.875.867-.217.153-.325.257-.379.328-.038.052-.038.07-.038.089a.75.75 0 0 1-1.5 0c0-.794.544-1.286 1.057-1.645.28-.196.4-.332.458-.426a.54.54 0 0 0 .075-.312c0-.3-.244-.641-.84-.641a1 1 0 0 0-.608.223c-.167.138-.231.287-.231.418a.75.75 0 0 1-1.5 0c0-.674.345-1.22.78-1.577M8 12a1 1 0 1 0 0-2 1 1 0 0 0 0 2" clip-rule="evenodd"/></svg> icon next to the selector in the report selector settings window. Hover over the icon to bring up the tooltip.

   - Manual input

     * **Field or parameter**: Field name you can use to link the selector with other widgets in the [alias](../dashboard/link.md#alias) configuration window. This is a required field.
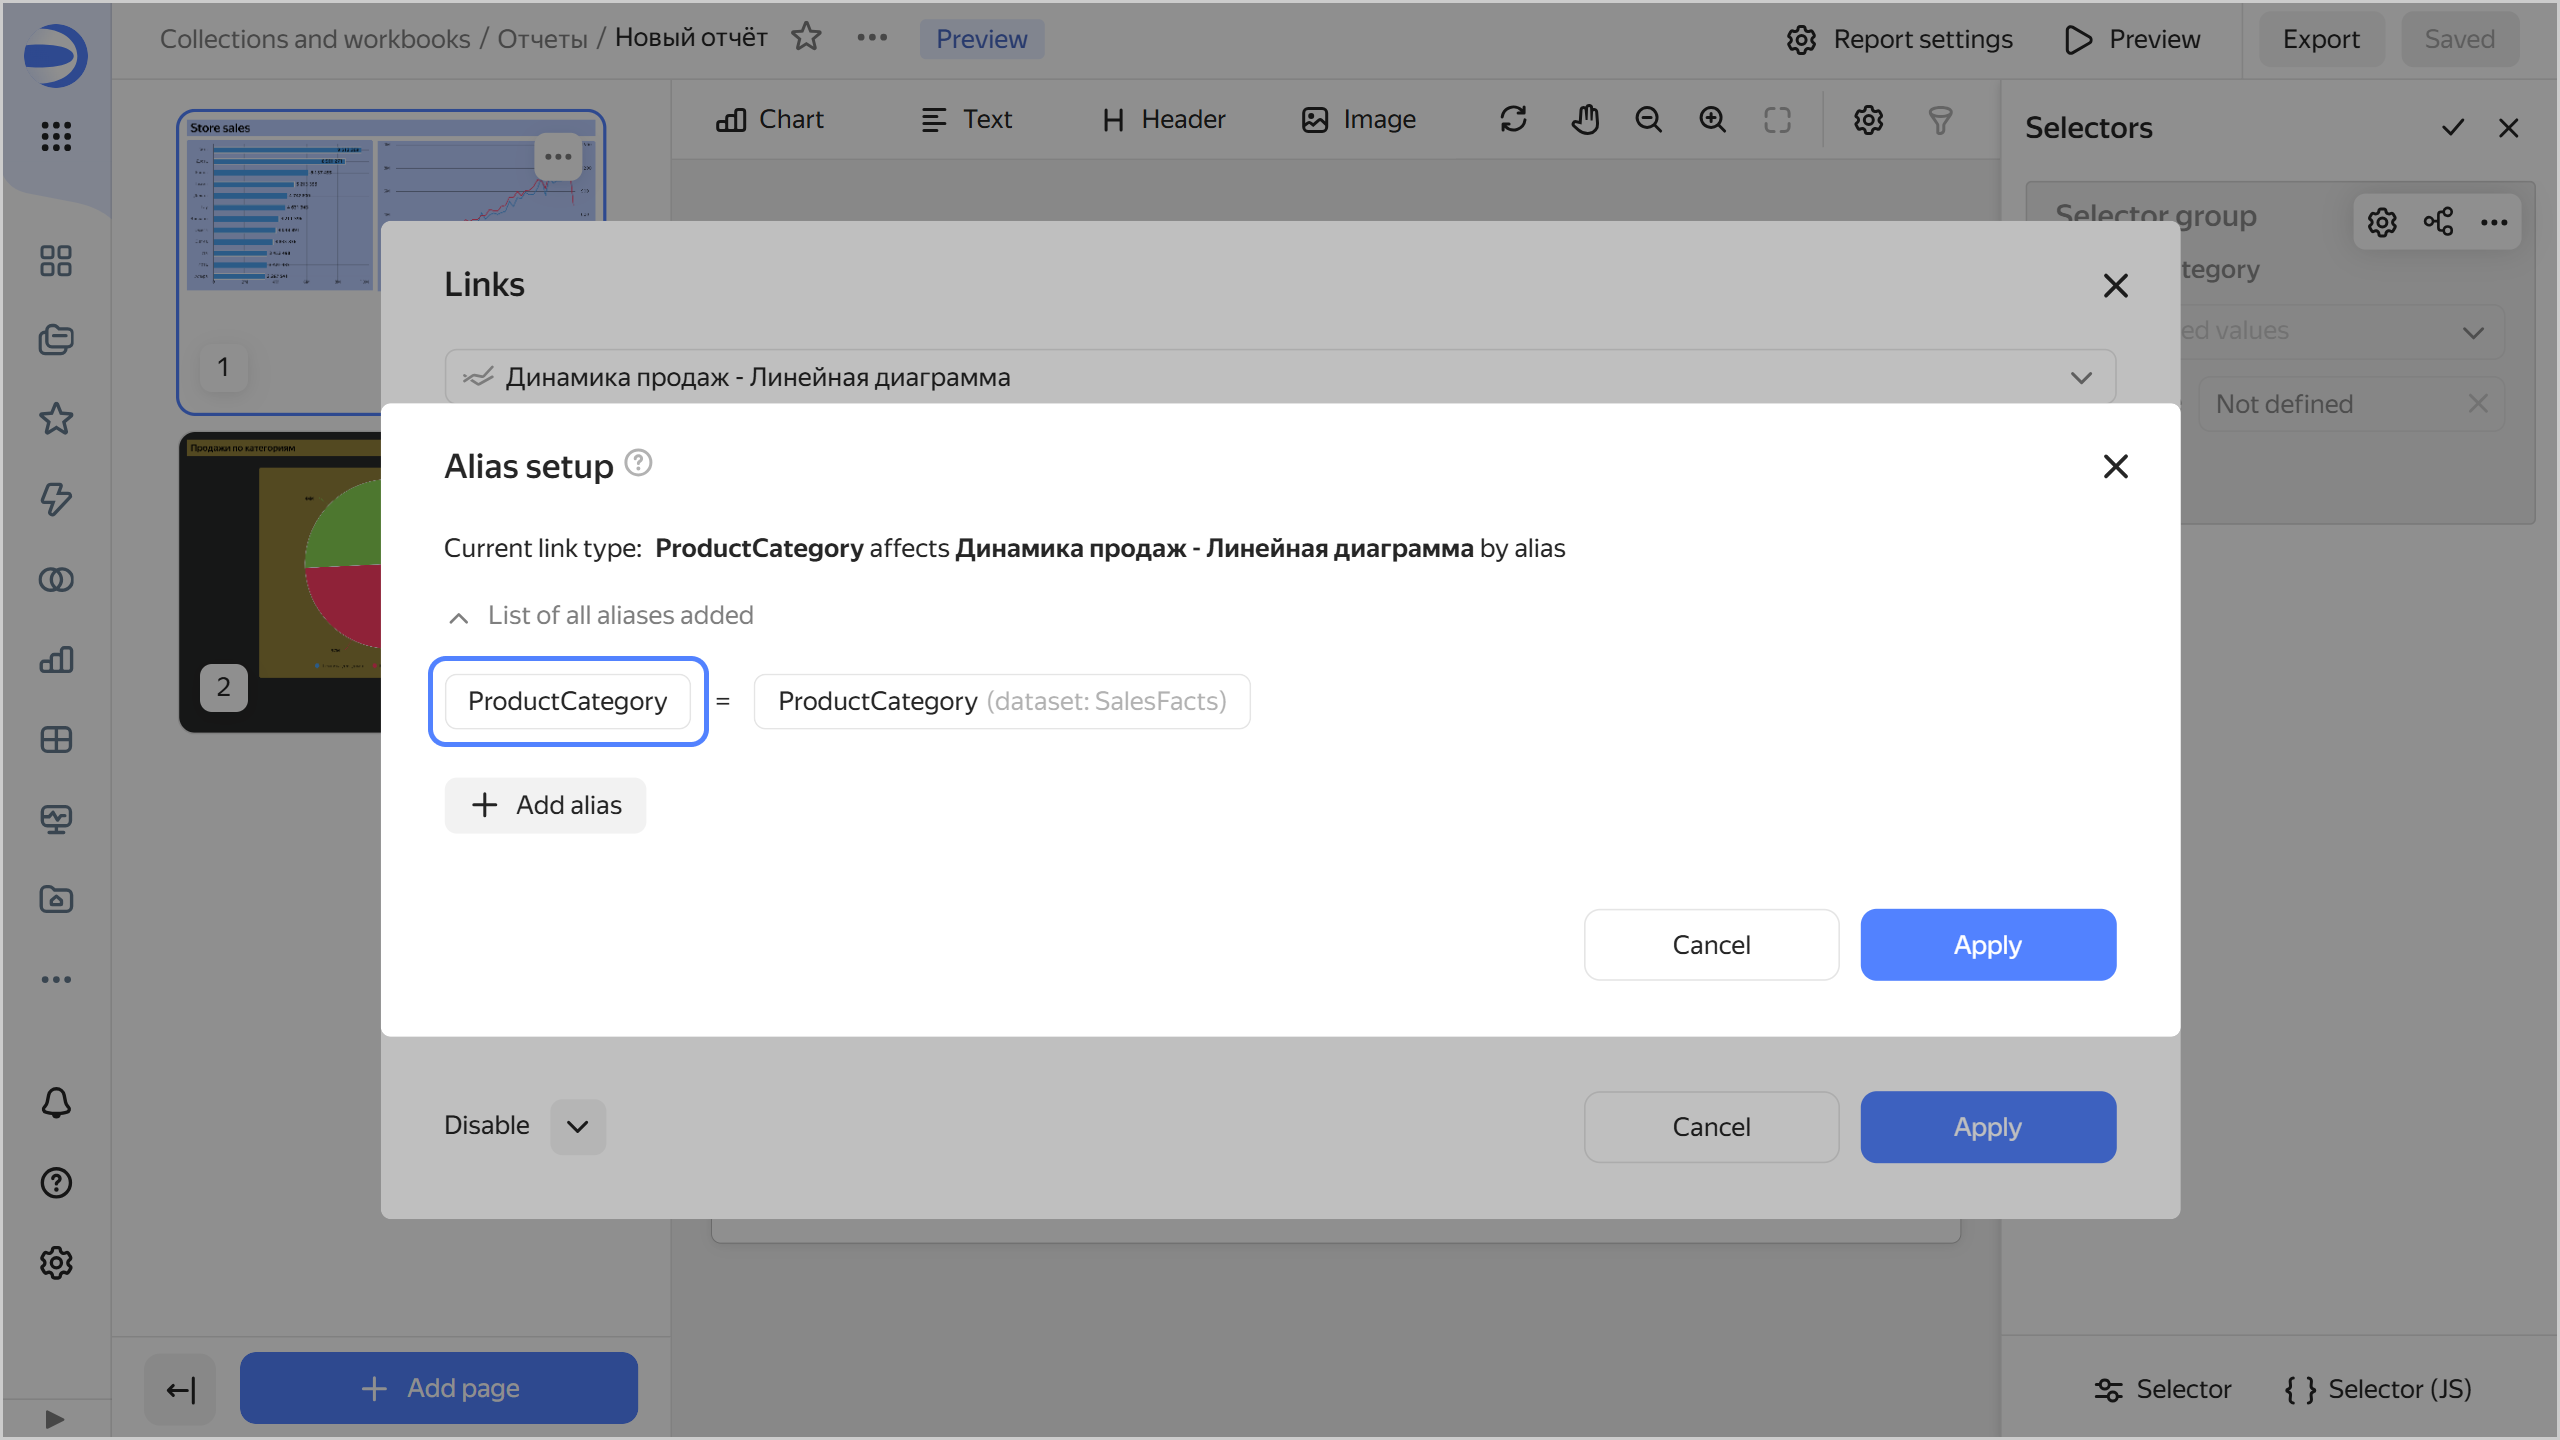
       ![image](../_assets/datalens/report/add-alias.png)

     * **Selector type**: Drop-down list, input field, calendar, or checkbox.

       {% note info %}

       * **Calendar** is only available for fields of the `Date` or `Date and time` type.
       * **Checkbox** is only available for fields of the `Boolean` type.
       * Measure selectors can only have the **Input field** type.

       {% endnote %}

     * **Operation**: Comparison operation for the selector to filter the chart values (e.g., **Equal to**, **Greater than**, or **Less than**). If the field is left blank, the selector will filter by the **Equal to** operation by default. The list of available operations depends on the field type. Do not specify an operation if the selector filters the QL chart.
     * **Required field**: Sets the selector value as a required parameter. When enabled, `*` is appended to the selector name. It is not available for the **Checkbox** selector type.
     * **Multiple choice**: Allows choosing several values in the selector. It is only available for the **List** selector type.
     * **Possible values**: List of values to select. It is only available for the **List** selector type.
     * **Range**: Allows setting a time interval in the selector. It is only available for the **Calendar** selector type.
     * **Time**: Allows specifying time. It is only available for the **Calendar** selector type.
     * **Default value**: Applied initially when you open the report. This field must be set for the **List** type; otherwise, no value will be available in the selector. This is a required field if the **Required field** option is enabled.

     * **Header**: To choose the selector for linking with other widgets. This is a required field.
       
       Select the header location below: `Left` (default), `Top`, or `Hidden` to hide it from the report selector settings window. It is not available for the **Checkbox** selector type.

     * **Inner title**: Allows specifying text inside a selector. For example, you can use it to display an operation inside a selector. It is not available for the **Checkbox** selector type.
     * **Coloring**: Allows you to highlight important selectors. It is not available for the **Checkbox** selector type.
     * **Tooltip**: This option allows adding a text comment to a selector. By default, with this option enabled, the tooltip text is taken from the field description in the [dataset](../dataset/index.md). You can edit the tooltip text. Changing the field description in the dataset will not automatically update the text.

       When the option is enabled, you will see the <!-- diplodoc:svg ![image](../_assets/console-icons/circle-question.svg) --><svg xmlns="http://www.w3.org/2000/svg" width="16" height="16" fill="none" viewBox="0 0 16 16"><path fill="currentColor" fill-rule="evenodd" d="M8 13.5a5.5 5.5 0 1 0 0-11 5.5 5.5 0 0 0 0 11M8 15A7 7 0 1 0 8 1a7 7 0 0 0 0 14M6.44 4.54c.43-.354.994-.565 1.56-.565 1.217 0 2.34.82 2.34 2.14 0 .377-.078.745-.298 1.1-.208.339-.513.614-.875.867-.217.153-.325.257-.379.328-.038.052-.038.07-.038.089a.75.75 0 0 1-1.5 0c0-.794.544-1.286 1.057-1.645.28-.196.4-.332.458-.426a.54.54 0 0 0 .075-.312c0-.3-.244-.641-.84-.641a1 1 0 0 0-.608.223c-.167.138-.231.287-.231.418a.75.75 0 0 1-1.5 0c0-.674.345-1.22.78-1.577M8 12a1 1 0 1 0 0-2 1 1 0 0 0 0 2" clip-rule="evenodd"/></svg> icon next to the selector in the report selector settings window. Hover over the icon to bring up the tooltip.

   {% endlist %}

   In [QL charts](../concepts/chart/ql-charts.md), you can manage [selector parameters](../operations/chart/create-sql-chart.md#selector-parameters) from the **Parameters** tab in the chart editing area and use the **Query** tab to specify a variable in the query in `{{ variable }}` format.

1. Optionally, add another selector to the widget. To do this, on the left side under **Selectors**, click <!-- diplodoc:svg ![image](../_assets/console-icons/plus.svg) --><svg xmlns="http://www.w3.org/2000/svg" width="16" height="16" fill="none" viewBox="0 0 16 16"><path fill="currentColor" fill-rule="evenodd" d="M8 1.75a.75.75 0 0 1 .75.75v4.75h4.75a.75.75 0 0 1 0 1.5H8.75v4.75a.75.75 0 0 1-1.5 0V8.75H2.5a.75.75 0 0 1 0-1.5h4.75V2.5A.75.75 0 0 1 8 1.75" clip-rule="evenodd"/></svg> **Add selector** and repeat the actions from the previous step. You can also duplicate the new selector or copy it to the clipboard. To do this, under **Selectors**, click <!-- diplodoc:svg ![image](../_assets/console-icons/ellipsis.svg) --><svg xmlns="http://www.w3.org/2000/svg" width="16" height="16" fill="none" viewBox="0 0 16 16"><path fill="currentColor" fill-rule="evenodd" d="M3 9.5a1.5 1.5 0 1 0 0-3 1.5 1.5 0 0 0 0 3M9.5 8a1.5 1.5 0 1 1-3 0 1.5 1.5 0 0 1 3 0m5 0a1.5 1.5 0 1 1-3 0 1.5 1.5 0 0 1 3 0" clip-rule="evenodd"/></svg> next to the selector and select:

   * **Duplicate**: This will add a new selector with the same parameters to the widget.
   * **Copy to clipboard**: You can paste the selector you copied into a different widget using the **Paste** button in the **Selectors** section or to a report using the **Insert** button on the bottom panel of the report page.
   
     {% cut "Inserting a selector" %}
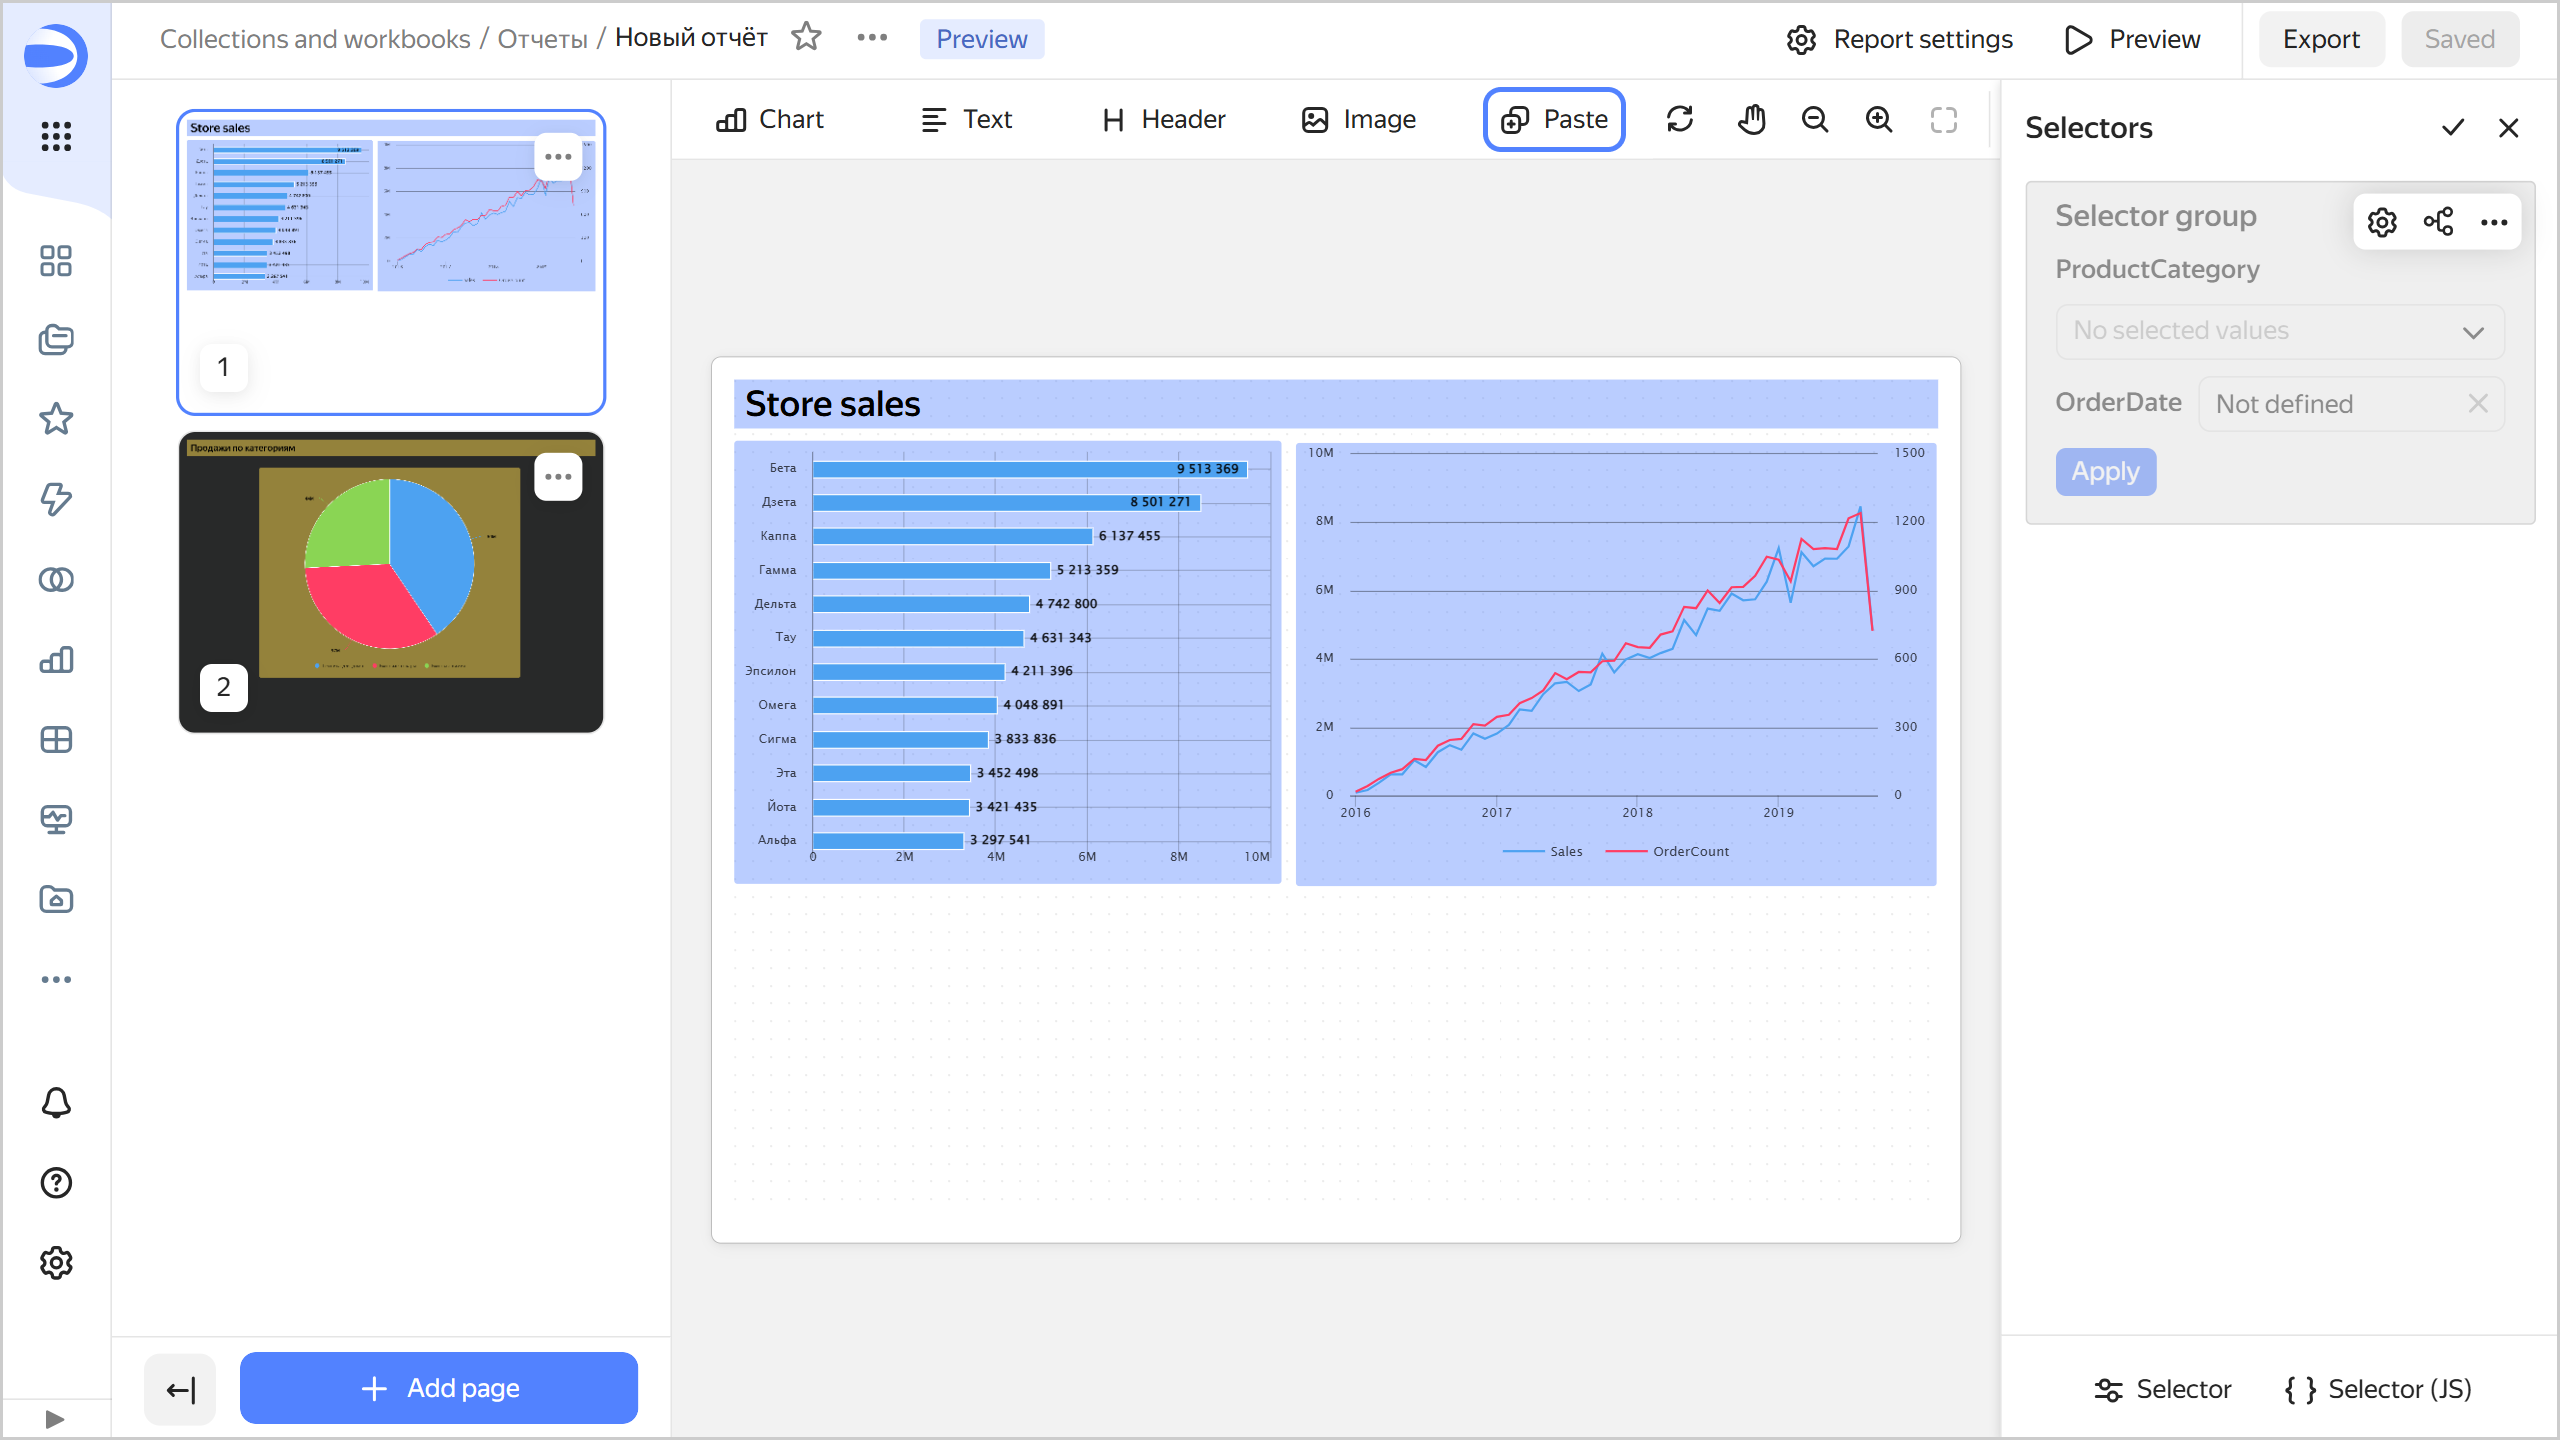
     
     ![image](../_assets/datalens/report/report-selector-insert.png)
     
     {% endcut %}

1. Optionally, click <!-- diplodoc:svg ![image](../_assets/console-icons/gear.svg) --><svg xmlns="http://www.w3.org/2000/svg" width="16" height="16" fill="none" viewBox="0 0 16 16"><path fill="currentColor" fill-rule="evenodd" d="M7.199 2H8.8a.2.2 0 0 1 .2.2c0 1.808 1.958 2.939 3.524 2.034a.2.2 0 0 1 .271.073l.802 1.388a.2.2 0 0 1-.073.272c-1.566.904-1.566 3.164 0 4.069a.2.2 0 0 1 .073.271l-.802 1.388a.2.2 0 0 1-.271.073C10.958 10.863 9 11.993 9 13.8a.2.2 0 0 1-.199.2H7.2a.2.2 0 0 1-.2-.2c0-1.808-1.958-2.938-3.524-2.034a.2.2 0 0 1-.272-.073l-.8-1.388a.2.2 0 0 1 .072-.271c1.566-.905 1.566-3.165 0-4.07a.2.2 0 0 1-.073-.27l.801-1.389a.2.2 0 0 1 .272-.072C5.042 5.138 7 4.007 7 2.199c0-.11.089-.199.199-.199M5.5 2.2c0-.94.76-1.7 1.699-1.7H8.8c.94 0 1.7.76 1.7 1.7a.85.85 0 0 0 1.274.735 1.7 1.7 0 0 1 2.32.622l.802 1.388c.469.813.19 1.851-.622 2.32a.85.85 0 0 0 0 1.472 1.7 1.7 0 0 1 .622 2.32l-.802 1.388a1.7 1.7 0 0 1-2.32.622.85.85 0 0 0-1.274.735c0 .939-.76 1.7-1.699 1.7H7.2a1.7 1.7 0 0 1-1.699-1.7.85.85 0 0 0-1.274-.735 1.7 1.7 0 0 1-2.32-.622l-.802-1.388a1.7 1.7 0 0 1 .622-2.32.85.85 0 0 0 0-1.471 1.7 1.7 0 0 1-.622-2.32l.801-1.389a1.7 1.7 0 0 1 2.32-.622A.85.85 0 0 0 5.5 2.2m4 5.8a1.5 1.5 0 1 1-3 0 1.5 1.5 0 0 1 3 0M11 8a3 3 0 1 1-6 0 3 3 0 0 1 6 0" clip-rule="evenodd"/></svg> **Advanced settings** and specify widget settings:

   * **Name**: If you enable this option, the `Selector group` name will be displayed at the top of the widget. In the field on the right, you can enter your own name.
   * **Apply button**: Adds a widget button which applies the values of all selectors in the widget. The selector values are not applied until you click the button.
   * **Reset button**: Adds a widget button which resets the values of all the widget selectors to their defaults.
   * **Dependent selector autoupdate**: Enables dependent selectors to influence one another before you click the **Apply** button. Available for widgets with multiple selectors and the **Apply button** option enabled.
   * Optionally, for a widget with multiple selectors, customize the selector arrangement. To do this, arrange the selectors as needed by dragging them and adjust the width of each one:

      * `Auto`: Automatic selector width.
      * `%`: Selector width as a percentage of the widget's total width.
      * `px`: Selector width in pixels.

   Click **Save**.
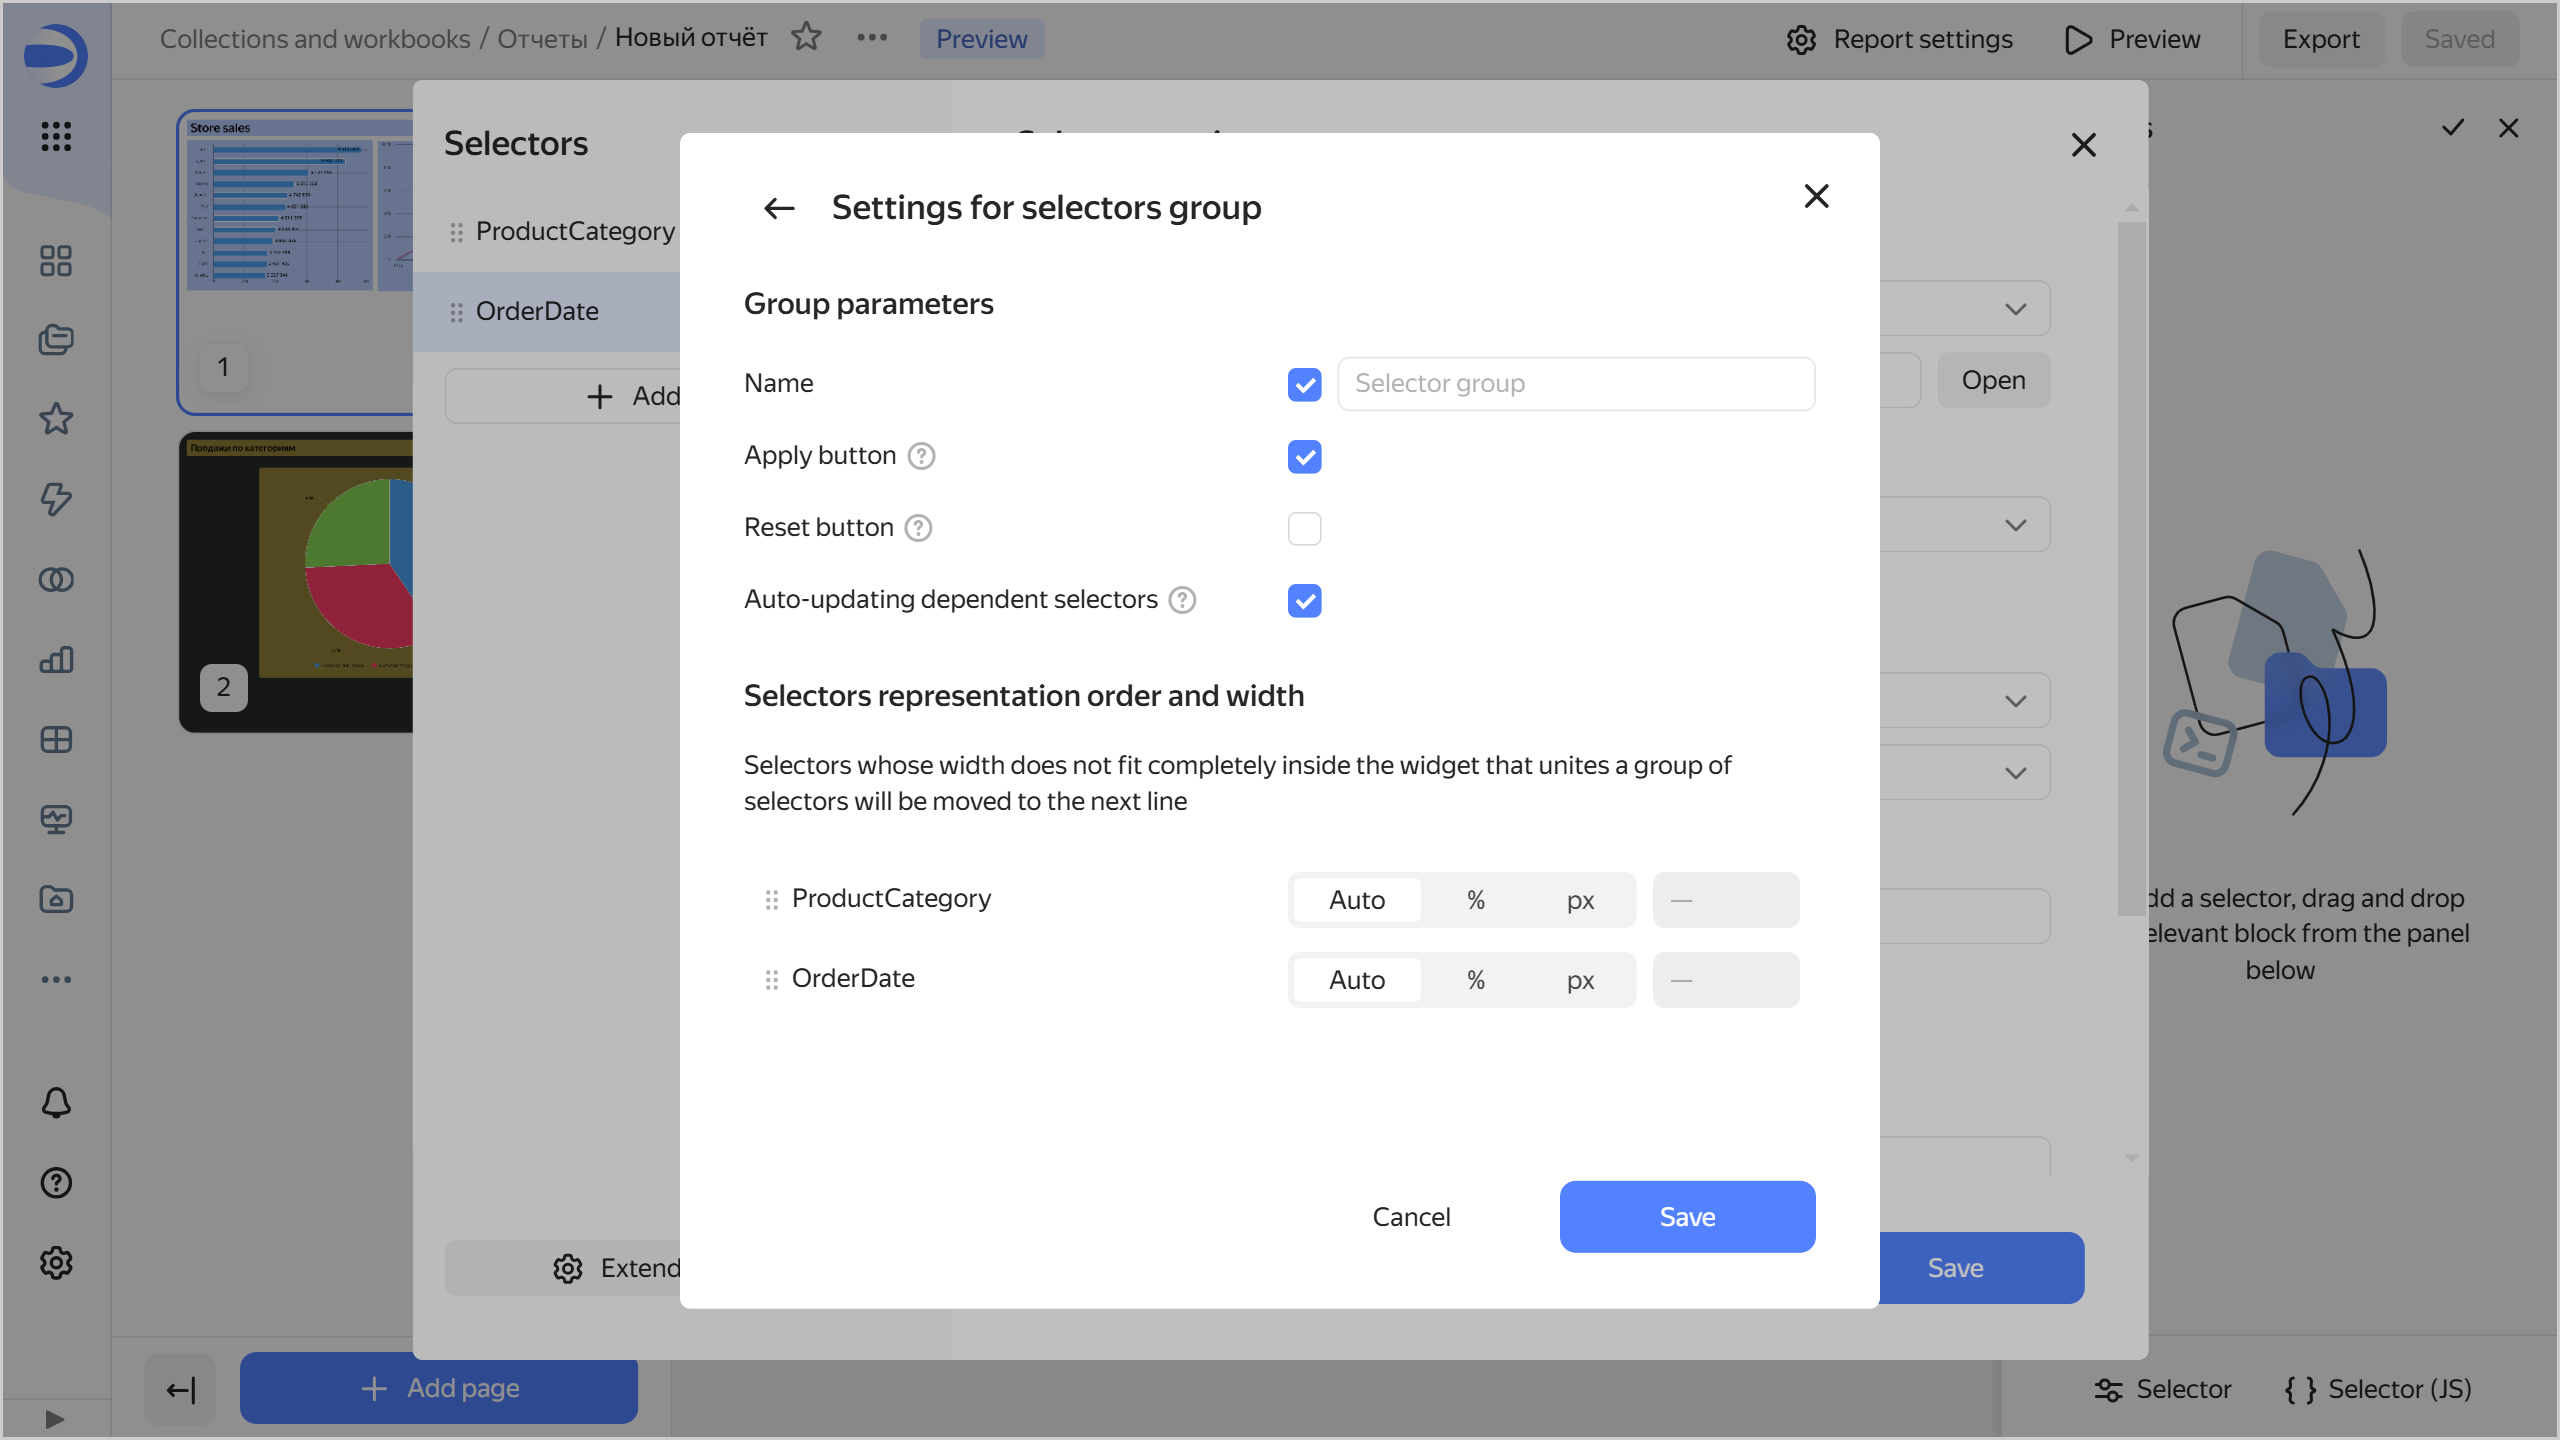
   ![image](../_assets/datalens/report/selector-extending-settings.png)

1. Click **Save**. The widget will appear in the **Selectors** window. The selectors section will automatically scroll to the added widget.
1. Optionally, add another widget to the report. To do this, repeat steps 4-7.
1. Return to filter mode. To do this, click <!-- diplodoc:svg ![icon](../_assets/console-icons/check.svg) --><svg xmlns="http://www.w3.org/2000/svg" width="16" height="16" fill="none" viewBox="0 0 16 16"><path fill="currentColor" fill-rule="evenodd" d="M13.488 3.43a.75.75 0 0 1 .081 1.058l-6 7a.75.75 0 0 1-1.1.042l-3.5-3.5A.75.75 0 0 1 4.03 6.97l2.928 2.927 5.473-6.385a.75.75 0 0 1 1.057-.081" clip-rule="evenodd"/></svg>.
1. In the top-right corner, click **Save**.

You can now control filtering in a report by choosing values in selectors.

{% note warning %}

If you add a field selector to a report, filters added at the chart level will no longer apply to the chart in the report.

{% endnote %}


## Adding a JS selector {#add-js-selector}

To add a [JS selector](../charts/editor/widgets/controls.md) to a report:

1. Open the **Selectors** window. To do this, click <!-- diplodoc:svg ![icon](../_assets/console-icons/funnel.svg) --><svg xmlns="http://www.w3.org/2000/svg" width="16" height="16" fill="none" viewBox="0 0 16 16"><path fill="currentColor" fill-rule="evenodd" d="M12.5 4c0 .174-.071.513-.885.888S9.538 5.5 8 5.5s-2.799-.237-3.615-.612C3.57 4.513 3.5 4.174 3.5 4s.071-.513.885-.888S6.462 2.5 8 2.5s2.799.237 3.615.612c.814.375.885.714.885.888m-1.448 2.66C10.158 6.888 9.115 7 8 7s-2.158-.113-3.052-.34l1.98 2.905c.21.308.322.672.322 1.044v3.37q.088.02.25.021c.422 0 .749-.14.95-.316.185-.162.3-.38.3-.684v-2.39c0-.373.112-.737.322-1.045zM8 1c3.314 0 6 1 6 3a3.24 3.24 0 0 1-.563 1.826l-3.125 4.584a.35.35 0 0 0-.062.2V13c0 1.5-1.25 2.5-2.75 2.5s-1.75-1-1.75-1v-3.89a.35.35 0 0 0-.061-.2L2.563 5.826A3.24 3.24 0 0 1 2 4c0-2 2.686-3 6-3m-.88 12.936q-.015-.008-.013-.01z" clip-rule="evenodd"/></svg> at the top right.
   If your report already has selectors, switch to edit mode. To do this, click <!-- diplodoc:svg ![icon](../_assets/console-icons/pencil.svg) --><svg xmlns="http://www.w3.org/2000/svg" width="16" height="16" fill="none" viewBox="0 0 16 16"><path fill="currentColor" fill-rule="evenodd" d="M11.423 1A3.577 3.577 0 0 1 15 4.577c0 .27-.108.53-.3.722l-.528.529-1.971 1.971-5.059 5.059a3 3 0 0 1-1.533.82l-2.638.528a1 1 0 0 1-1.177-1.177l.528-2.638a3 3 0 0 1 .82-1.533l5.059-5.059 2.5-2.5c.191-.191.451-.299.722-.299m-2.31 4.009-4.91 4.91a1.5 1.5 0 0 0-.41.766l-.38 1.903 1.902-.38a1.5 1.5 0 0 0 .767-.41l4.91-4.91a2.08 2.08 0 0 0-1.88-1.88m3.098.658a3.6 3.6 0 0 0-1.878-1.879l1.28-1.28c.995.09 1.788.884 1.878 1.88z" clip-rule="evenodd"/></svg>.
1. From the panel below, drag the **Selector (JS)** widget to the **Selectors** section.
   
   {% cut "Adding a JS selector" %}
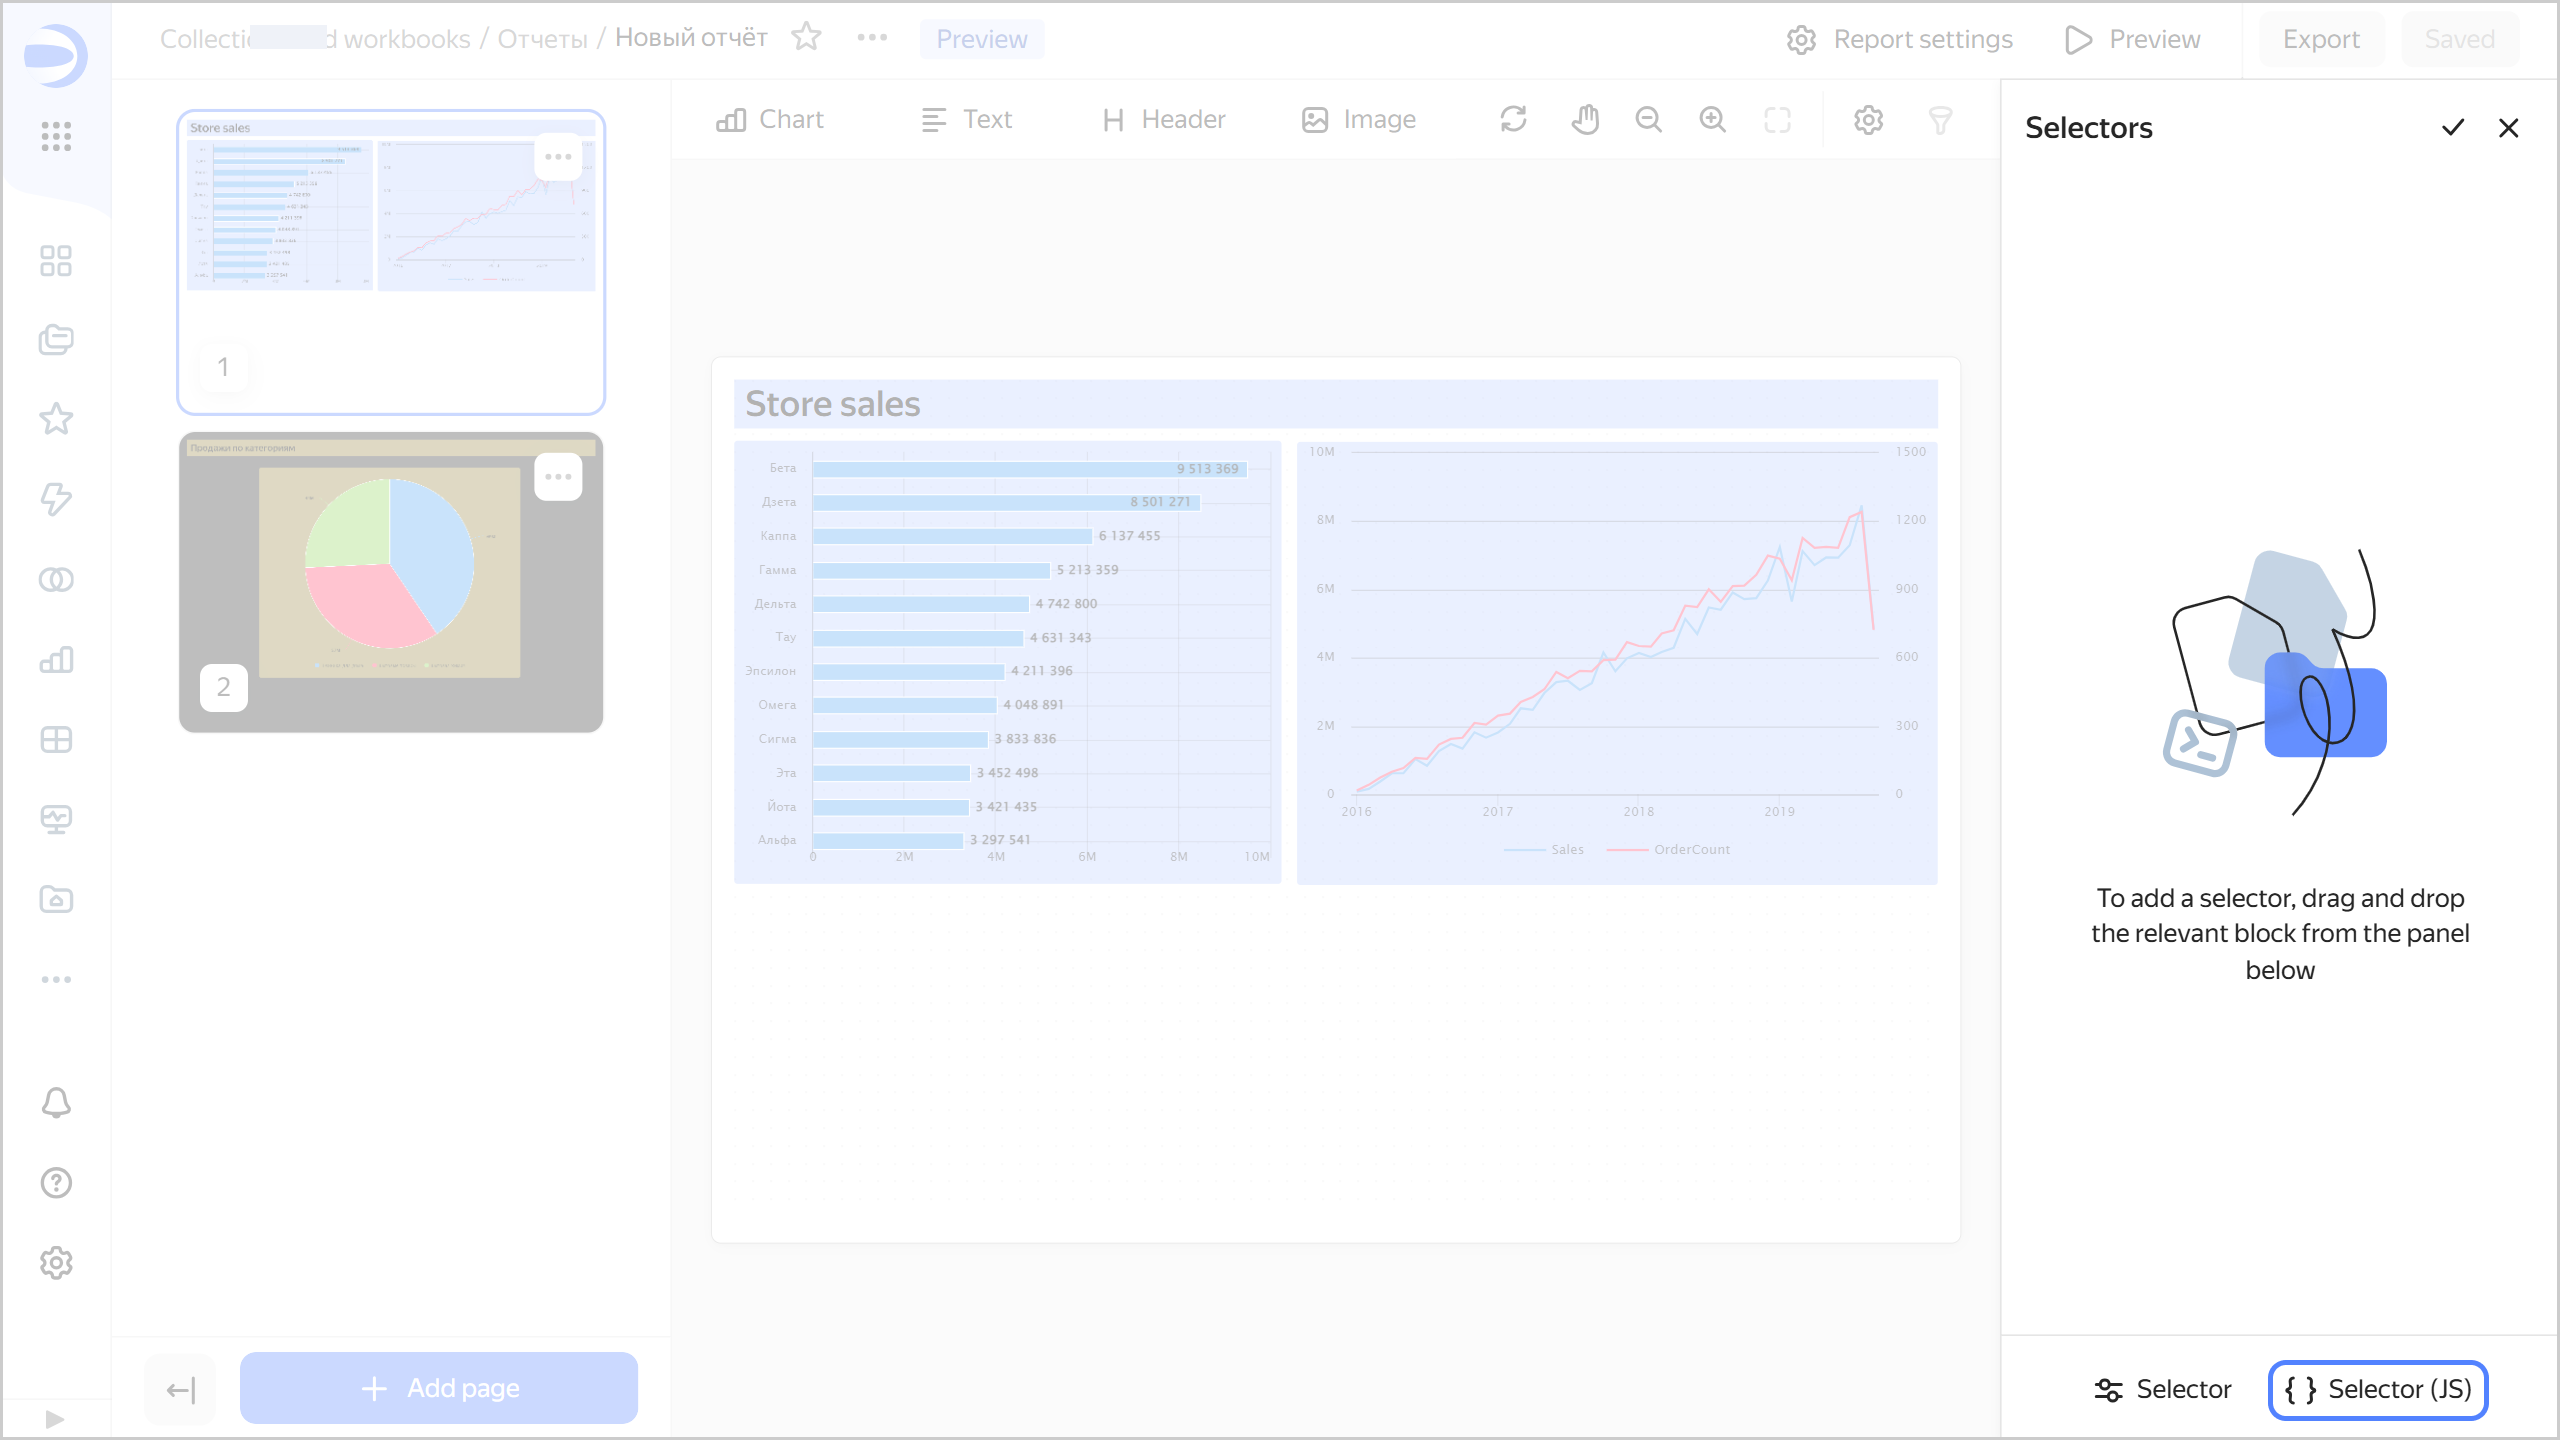
   
   ![image](../_assets/datalens/report/report-js-selector-add.png)
     
   {% endcut %}

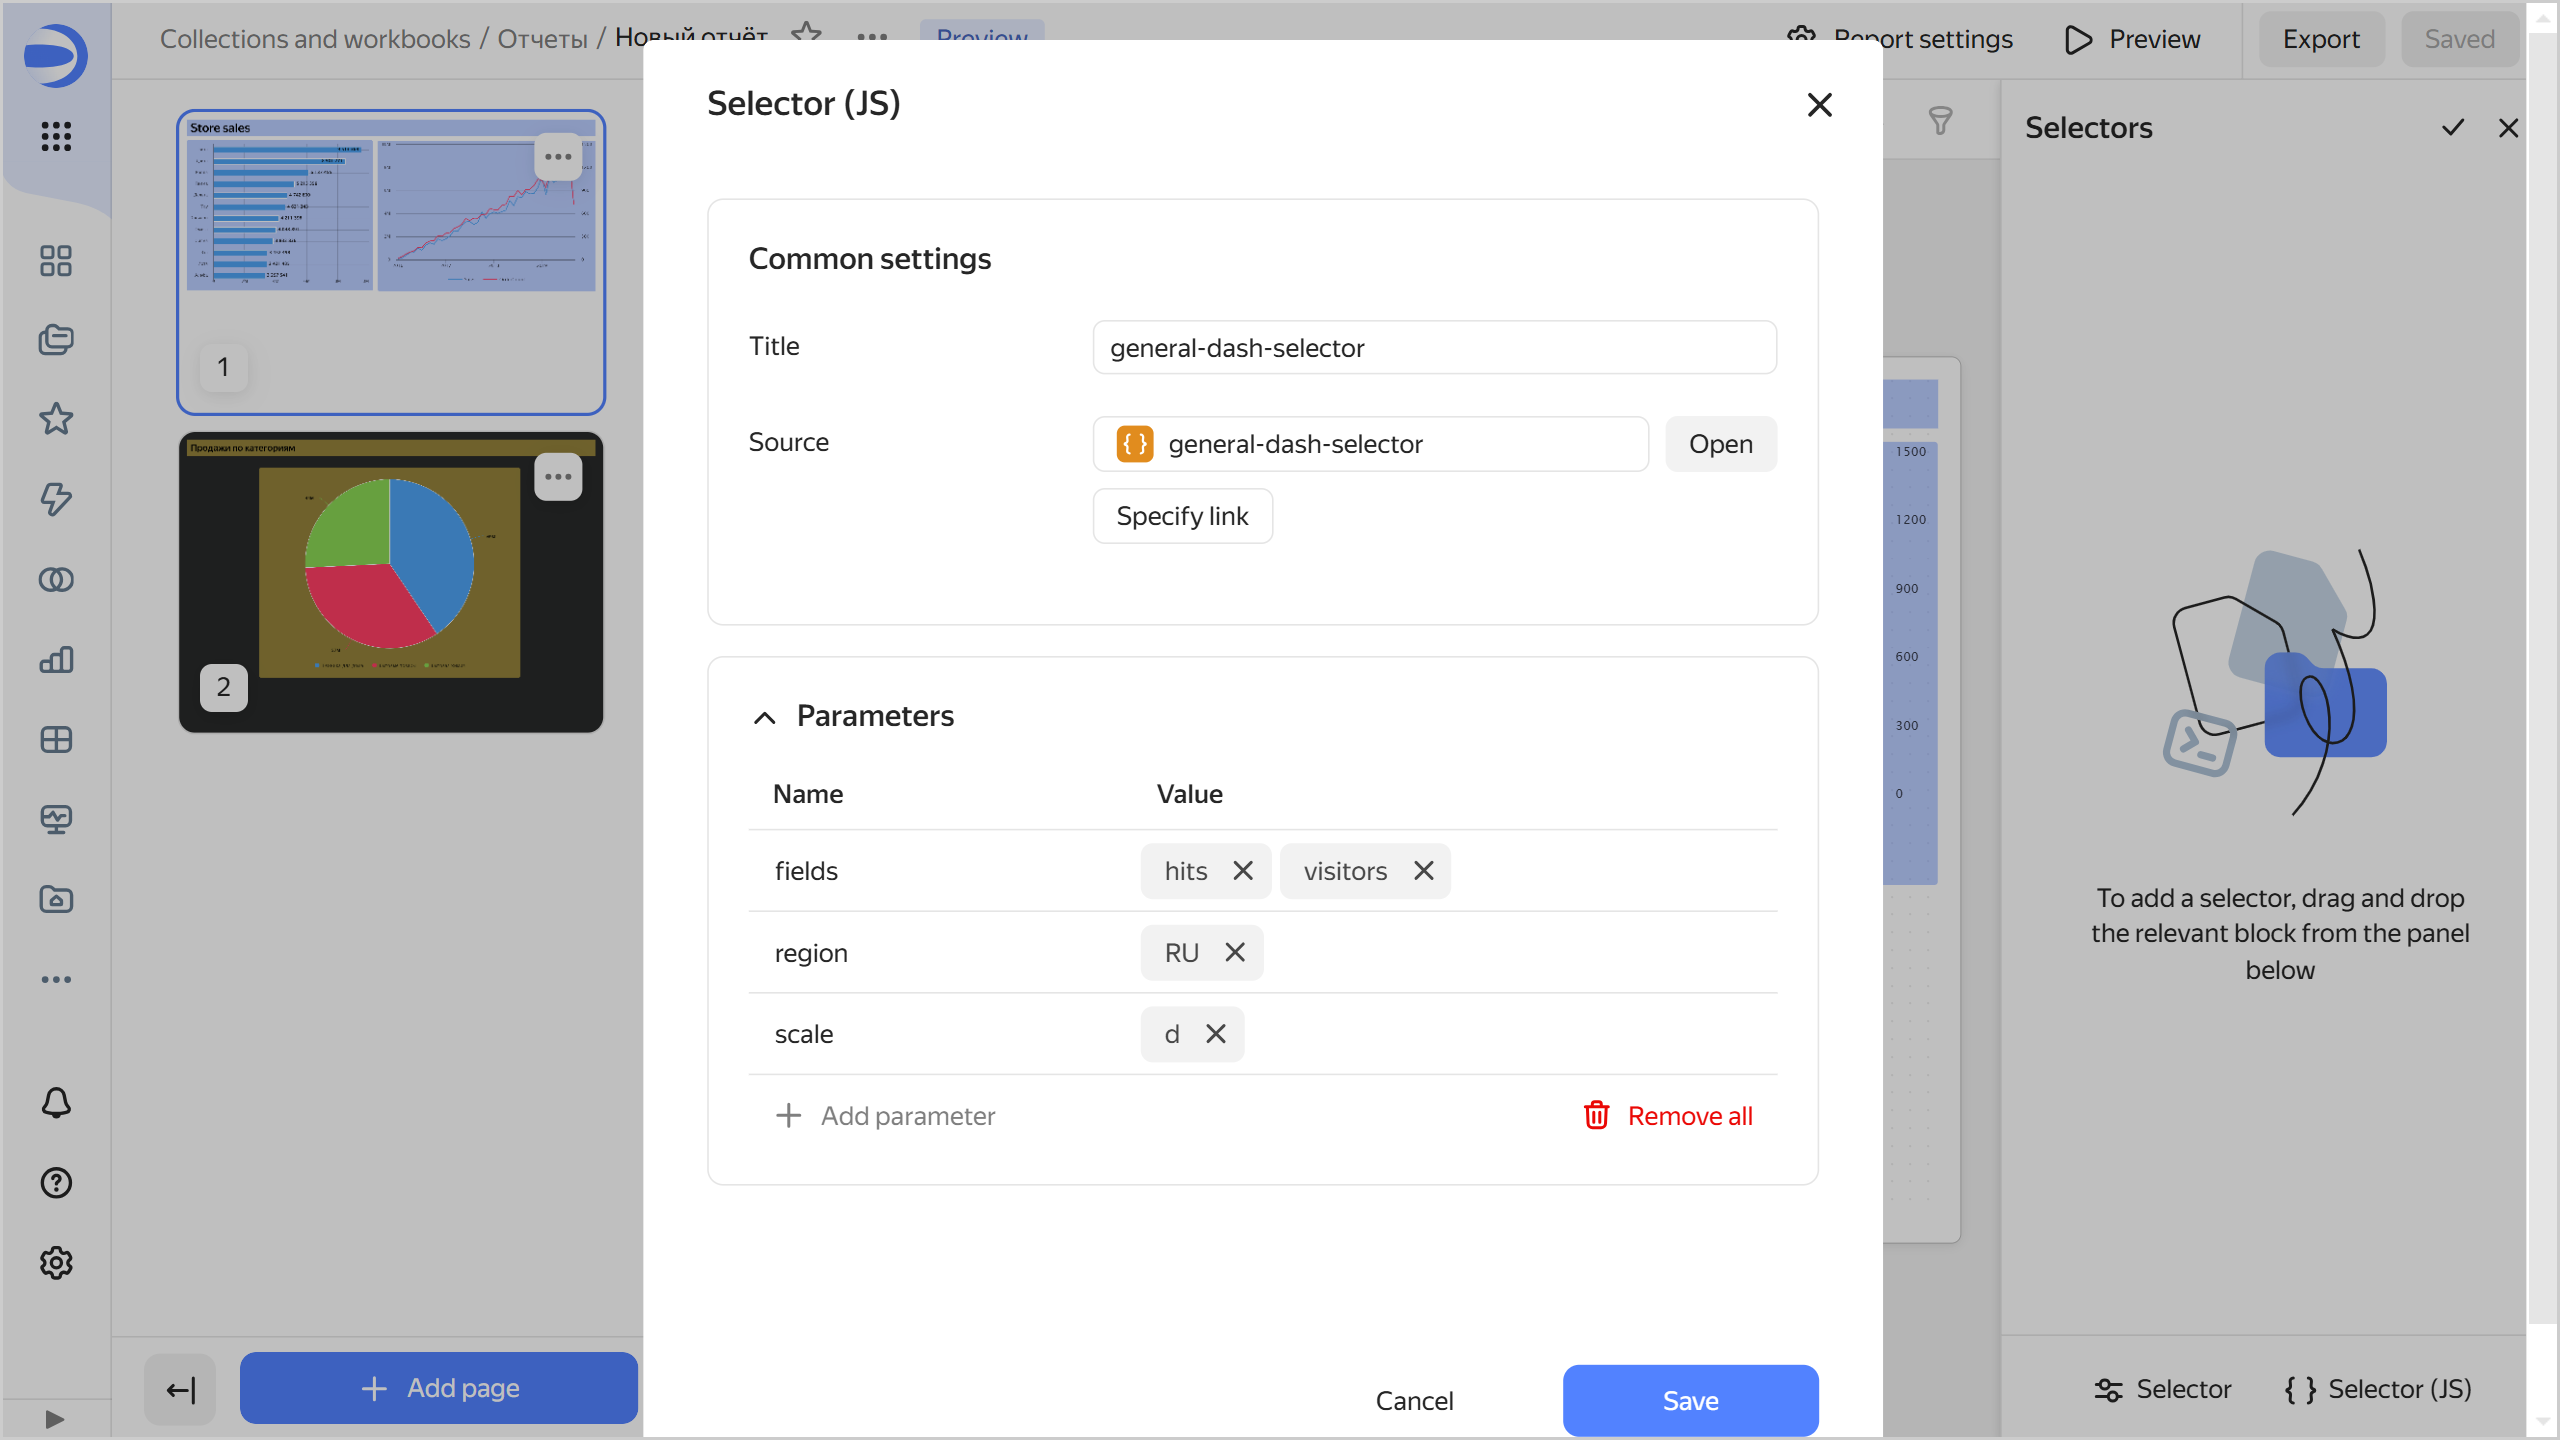
1. Under **Selector settings** choose the source and specify the selector parameters:

   * **Header**: To choose the selector for linking with other widgets. By default, when you add a selector, the header text is substituted from the object name. This is a required field.
   * **Source**: Sets the selector created in Editor. Choose the selector:

     {% list tabs %}

     - From the list of objects

       Click **Select** and choose the selector from the list of objects. If you have already chosen the selector, you can proceed to edit it by clicking **Open** next to the selector.

     - Using a link

       Click **Specify link**. Enter the selector URL into the input field and click **OK** below.

     {% endlist %}

   * **Parameters**: Sets a list of selector parameters and their default values. For the widget to work correctly, specify the selector parameters listed on the [Params](../charts/editor/tabs.md#params) tab.
   ![image](../_assets/datalens/report/report-js-selector.png)

1. Click **Save**. The widget will appear in the **Selectors** window. The selectors section will automatically scroll to the added widget.


## Setting up and deleting a selector {#selector-edit}

1. Open the report in which you want to change the selector settings.
1. Open the **Selectors** window. To do this, click <!-- diplodoc:svg ![icon](../_assets/console-icons/funnel.svg) --><svg xmlns="http://www.w3.org/2000/svg" width="16" height="16" fill="none" viewBox="0 0 16 16"><path fill="currentColor" fill-rule="evenodd" d="M12.5 4c0 .174-.071.513-.885.888S9.538 5.5 8 5.5s-2.799-.237-3.615-.612C3.57 4.513 3.5 4.174 3.5 4s.071-.513.885-.888S6.462 2.5 8 2.5s2.799.237 3.615.612c.814.375.885.714.885.888m-1.448 2.66C10.158 6.888 9.115 7 8 7s-2.158-.113-3.052-.34l1.98 2.905c.21.308.322.672.322 1.044v3.37q.088.02.25.021c.422 0 .749-.14.95-.316.185-.162.3-.38.3-.684v-2.39c0-.373.112-.737.322-1.045zM8 1c3.314 0 6 1 6 3a3.24 3.24 0 0 1-.563 1.826l-3.125 4.584a.35.35 0 0 0-.062.2V13c0 1.5-1.25 2.5-2.75 2.5s-1.75-1-1.75-1v-3.89a.35.35 0 0 0-.061-.2L2.563 5.826A3.24 3.24 0 0 1 2 4c0-2 2.686-3 6-3m-.88 12.936q-.015-.008-.013-.01z" clip-rule="evenodd"/></svg> at the top right.
1. Go to edit mode. To do this, click <!-- diplodoc:svg ![icon](../_assets/console-icons/pencil.svg) --><svg xmlns="http://www.w3.org/2000/svg" width="16" height="16" fill="none" viewBox="0 0 16 16"><path fill="currentColor" fill-rule="evenodd" d="M11.423 1A3.577 3.577 0 0 1 15 4.577c0 .27-.108.53-.3.722l-.528.529-1.971 1.971-5.059 5.059a3 3 0 0 1-1.533.82l-2.638.528a1 1 0 0 1-1.177-1.177l.528-2.638a3 3 0 0 1 .82-1.533l5.059-5.059 2.5-2.5c.191-.191.451-.299.722-.299m-2.31 4.009-4.91 4.91a1.5 1.5 0 0 0-.41.766l-.38 1.903 1.902-.38a1.5 1.5 0 0 0 .767-.41l4.91-4.91a2.08 2.08 0 0 0-1.88-1.88m3.098.658a3.6 3.6 0 0 0-1.878-1.879l1.28-1.28c.995.09 1.788.884 1.878 1.88z" clip-rule="evenodd"/></svg>.
1. To the right of the widget, select:
   
   * <!-- diplodoc:svg ![icon](../_assets/console-icons/gear.svg) --><svg xmlns="http://www.w3.org/2000/svg" width="16" height="16" fill="none" viewBox="0 0 16 16"><path fill="currentColor" fill-rule="evenodd" d="M7.199 2H8.8a.2.2 0 0 1 .2.2c0 1.808 1.958 2.939 3.524 2.034a.2.2 0 0 1 .271.073l.802 1.388a.2.2 0 0 1-.073.272c-1.566.904-1.566 3.164 0 4.069a.2.2 0 0 1 .073.271l-.802 1.388a.2.2 0 0 1-.271.073C10.958 10.863 9 11.993 9 13.8a.2.2 0 0 1-.199.2H7.2a.2.2 0 0 1-.2-.2c0-1.808-1.958-2.938-3.524-2.034a.2.2 0 0 1-.272-.073l-.8-1.388a.2.2 0 0 1 .072-.271c1.566-.905 1.566-3.165 0-4.07a.2.2 0 0 1-.073-.27l.801-1.389a.2.2 0 0 1 .272-.072C5.042 5.138 7 4.007 7 2.199c0-.11.089-.199.199-.199M5.5 2.2c0-.94.76-1.7 1.699-1.7H8.8c.94 0 1.7.76 1.7 1.7a.85.85 0 0 0 1.274.735 1.7 1.7 0 0 1 2.32.622l.802 1.388c.469.813.19 1.851-.622 2.32a.85.85 0 0 0 0 1.472 1.7 1.7 0 0 1 .622 2.32l-.802 1.388a1.7 1.7 0 0 1-2.32.622.85.85 0 0 0-1.274.735c0 .939-.76 1.7-1.699 1.7H7.2a1.7 1.7 0 0 1-1.699-1.7.85.85 0 0 0-1.274-.735 1.7 1.7 0 0 1-2.32-.622l-.802-1.388a1.7 1.7 0 0 1 .622-2.32.85.85 0 0 0 0-1.471 1.7 1.7 0 0 1-.622-2.32l.801-1.389a1.7 1.7 0 0 1 2.32-.622A.85.85 0 0 0 5.5 2.2m4 5.8a1.5 1.5 0 1 1-3 0 1.5 1.5 0 0 1 3 0M11 8a3 3 0 1 1-6 0 3 3 0 0 1 6 0" clip-rule="evenodd"/></svg>: Widget settings. The available perameters are the same as when [adding](#add-selector) a selector.
   * <!-- diplodoc:svg ![image](../_assets/datalens/links.svg) --><svg xmlns="http://www.w3.org/2000/svg" width="16" height="17" fill="currentColor" aria-hidden="true" class="yc-icon"><svg xmlns="http://www.w3.org/2000/svg" fill="none" viewBox="0 0 16 17"><path fill="currentColor" fill-rule="evenodd" d="M5.916 7.527a2.668 2.668 0 1 0 0 1.333h1.417v2.667a2 2 0 0 0 2 2h.75a2.668 2.668 0 0 0 5.25-.667 2.667 2.667 0 0 0-5.249-.667h-.75a.667.667 0 0 1-.667-.666V4.86c0-.368.298-.667.666-.667h.751a2.668 2.668 0 1 0 0-1.333h-.75a2 2 0 0 0-2 2v2.667H5.915Zm-1.25.66a1.333 1.333 0 1 0 0 .012v-.012ZM14 3.527a1.333 1.333 0 1 1-2.667 0 1.333 1.333 0 0 1 2.667 0Zm-1.333 10.666a1.333 1.333 0 1 0 0-2.666 1.333 1.333 0 0 0 0 2.667Z" clip-rule="evenodd"/></svg></svg>: [Link](../dashboard/link.md) settings.
   * <!-- diplodoc:svg ![icon](../_assets/console-icons/ellipsis.svg) --><svg xmlns="http://www.w3.org/2000/svg" width="16" height="16" fill="none" viewBox="0 0 16 16"><path fill="currentColor" fill-rule="evenodd" d="M3 9.5a1.5 1.5 0 1 0 0-3 1.5 1.5 0 0 0 0 3M9.5 8a1.5 1.5 0 1 1-3 0 1.5 1.5 0 0 1 3 0m5 0a1.5 1.5 0 1 1-3 0 1.5 1.5 0 0 1 3 0" clip-rule="evenodd"/></svg>: Copying or deleting a widget. You can paste the copied widget into this or another report or dashboard using the **Insert** button on the widget panel.

1. Return to filter mode. To do this, click <!-- diplodoc:svg ![icon](../_assets/console-icons/check.svg) --><svg xmlns="http://www.w3.org/2000/svg" width="16" height="16" fill="none" viewBox="0 0 16 16"><path fill="currentColor" fill-rule="evenodd" d="M13.488 3.43a.75.75 0 0 1 .081 1.058l-6 7a.75.75 0 0 1-1.1.042l-3.5-3.5A.75.75 0 0 1 4.03 6.97l2.928 2.927 5.473-6.385a.75.75 0 0 1 1.057-.081" clip-rule="evenodd"/></svg>.
1. In the top-right corner of the report, click **Save**.

## Limits {#restrictions}

* You can only add selectors to a separate report area.
* Selectors filter data across all report pages.
* For measure selectors, only one type is available: **Input field**.
* We recommend that you always make your measure selectors independent from other selectors. To do this, set their [link](../dashboard/link.md) type to **Not linked** to other selectors in the **Links** section when editing the selector widget.