---
metadata:
  - name: generator
    content: Diplodoc Platform v5.63.0
alternate:
  - en/visualization-ref/indicator-chart
  - ru/visualization-ref/indicator-chart
  - href: en/visualization-ref/indicator-chart.md
    type: text/markdown
    title: Markdown version
csp:
  - script-src:
      - https://mc.yandex.ru
    img-src:
      - https://mc.yandex.ru
    connect-src:
      - https://mc.yandex.ru
      - wss://mc.yandex.ru
    child-src:
      - 'blob:'
      - https://mc.yandex.ru
    frame-src:
      - 'blob:'
      - https://mc.yandex.ru
    frame-ancestors:
      - 'blob:'
      - https://mc.yandex.ru
canonical: en/visualization-ref/indicator-chart.html
title: Indicator in DataLens On-premises
description: >-
  In this tutorial, you will learn how to create and customize the indicator
  visualization type in DataLens On-premises.
vcsPath: en/visualization-ref/indicator-chart.md
---

# Indicator <!-- diplodoc:svg ![](../_assets/datalens/indicator.svg) --><svg xmlns="http://www.w3.org/2000/svg" width="24" height="24" fill="none" viewBox="0 0 20 20"><path stroke="#027BF3" d="m3 17 1.372-.915a4 4 0 0 1 3.484-.466l1.409.47a4 4 0 0 0 4.465-1.395L15 13"/><path fill="#FC4F51" d="M3.722 11H2.338V6.816L1.202 7.888V6.696L2.538 5.44h1.184V11Zm1.574.064a.674.674 0 0 1-.496-.2.674.674 0 0 1-.2-.496.683.683 0 0 1 .696-.704c.192 0 .355.067.488.2a.67.67 0 0 1 .208.504.66.66 0 0 1-.208.496.664.664 0 0 1-.488.2ZM10.361 11H6.53v-.816c.411-.347.766-.653 1.064-.92.3-.267.544-.512.736-.736a2.66 2.66 0 0 0 .432-.656 1.53 1.53 0 0 0 .144-.648c0-.31-.082-.547-.248-.712-.165-.165-.41-.248-.736-.248-.154 0-.298.019-.432.056a1.69 1.69 0 0 0-.36.144 1.563 1.563 0 0 0-.288.184 2.45 2.45 0 0 0-.2.176v-.928c.043-.048.107-.101.192-.16.091-.059.206-.115.344-.168.14-.059.302-.107.488-.144a3.54 3.54 0 0 1 .664-.056c.326 0 .611.043.856.128.251.08.46.197.624.352.171.15.3.33.384.544.086.208.128.443.128.704 0 .304-.053.59-.16.856a3.057 3.057 0 0 1-.456.76c-.192.24-.429.477-.712.712-.277.23-.589.467-.936.712h2.304V11Zm6.874-4.008-1.288 3.336h-1l-1.28-3.416V11h-1.032V5.44h1.688l1.312 3.384 1.288-3.384h1.736V11h-1.424V6.992Z"/></svg> in DataLens On-premises

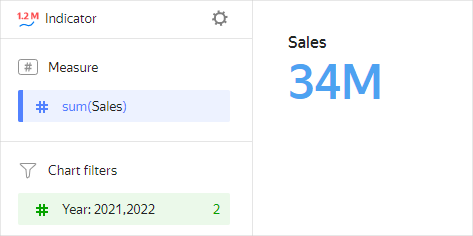
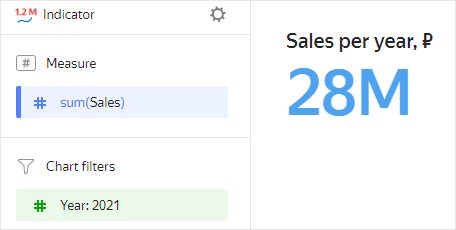
An indicator reflects the value of a single key measure. To build a more [complex](#markup-indicator) and meaningful indicator, use several measures.

* You may want to use indicators when a dashboard contains values you need to monitor on a regular basis to understand the general picture. This could be, for example, the number of incidents for the previous day, plan performance percentage, or year-on-year sales growth.

* Indicators are most commonly placed at the top or on the right side of a dashboard. Add no more than six indicators per screen so they remain in focus without confusing the user. Adjust widget sizes to reflect the importance of different metrics.
  ![indicator-chart](../_assets/datalens/visualization-ref/indicator-chart/indicator-chart.png)

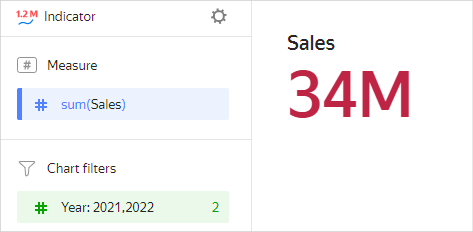
* You can set up the size and color of an indicator.

  {% list tabs %}

  - Visualization
    ![indicator-chart-red](../_assets/datalens/visualization-ref/indicator-chart/indicator-chart-red.png)

  - Source table

    Year |	Sales|	
    -----|---------| 
    2022|	6M |	
    2021|	28M |	
    2020|	18M |	
    2019|	9M | 
    2018|	1M |

  {% endlist %}


## Wizard sections {#wizard-sections}

Wizard<br/> section| Description
----- | ----
Measure | Measure. One measure that determines the indicator value.
Colors | The field from the **Measure** section is used. The setting in this section allows [changing the color](#color-setting) of the indicator.
Filters | Dimension or measure. Used as a filter.

## Creating an indicator {#create-diagram}

To create an indicator:


<!-- source: en/_includes/datalens/operations/datalens-workbooks-collections-note-step4.md -->
{% note warning %}

If you use the new DataLens object model with [workbooks and collections](../workbooks-collections/index.md):


1. Go to the DataLens home page.


1. Open the workbook, click **Create** in the top-right corner, and select the object you need.

Follow the guide from step 4.

{% endnote %}
<!-- endsource: en/_includes/datalens/operations/datalens-workbooks-collections-note-step4.md -->


1. <!-- source: en/_includes/datalens/visualization-ref/create-1.md -->
   Go to the DataLens home page.
   <!-- endsource: en/_includes/datalens/visualization-ref/create-1.md -->
1. <!-- source: en/_includes/datalens/visualization-ref/create-2.md -->
   In the left-hand panel, select <!-- diplodoc:svg ![chart](../_assets/console-icons/chart-column.svg) --><svg xmlns="http://www.w3.org/2000/svg" width="16" height="16" fill="none" viewBox="0 0 16 16"><g clip-path="url(#svg-qnr573bk__a)"><path fill="currentColor" fill-rule="evenodd" d="M11.5 3.5h2a.5.5 0 0 1 .5.5v8a.5.5 0 0 1-.5.5h-2a.5.5 0 0 1-.5-.5V4a.5.5 0 0 1 .5-.5m-2.5 9a.5.5 0 0 0 .5-.5V7a.5.5 0 0 0-.5-.5H7a.5.5 0 0 0-.5.5v5a.5.5 0 0 0 .5.5zm-4.5 0A.5.5 0 0 0 5 12v-2a.5.5 0 0 0-.5-.5h-2a.5.5 0 0 0-.5.5v2a.5.5 0 0 0 .5.5zm-1 1.5h-1a2 2 0 0 1-2-2v-2a2 2 0 0 1 2-2h2q.26 0 .5.063V7a2 2 0 0 1 2-2h2q.26 0 .5.063V4a2 2 0 0 1 2-2h2a2 2 0 0 1 2 2v8a2 2 0 0 1-2 2z" clip-rule="evenodd"/></g><defs><clipPath id="svg-qnr573bk__a"><path fill="currentColor" d="M0 0h16v16H0z"/></clipPath></defs></svg> **Charts**.
   <!-- endsource: en/_includes/datalens/visualization-ref/create-2.md -->
1. <!-- source: en/_includes/datalens/visualization-ref/create-3.md -->
   Click **Create chart** → **Chart**.
   <!-- endsource: en/_includes/datalens/visualization-ref/create-3.md -->
1. <!-- source: en/_includes/datalens/visualization-ref/create-4.md -->
   At the top left, click <!-- diplodoc:svg ![image](../_assets/console-icons/circles-intersection.svg) --><svg xmlns="http://www.w3.org/2000/svg" width="16" height="16" fill="none" viewBox="0 0 16 16"><path fill="currentColor" fill-rule="evenodd" d="M6.576 11.854a4 4 0 1 1 0-7.707A5.48 5.48 0 0 0 5 8c0 1.5.601 2.861 1.576 3.854M8 12.9a5.5 5.5 0 1 1 0-9.8 5.5 5.5 0 1 1 0 9.8m1.424-8.754A4.003 4.003 0 0 1 14.5 8a4 4 0 0 1-5.076 3.854A5.48 5.48 0 0 0 11 8c0-1.5-.601-2.861-1.576-3.854M8 4.877C8.914 5.61 9.5 6.737 9.5 8s-.586 2.39-1.5 3.123A4 4 0 0 1 6.5 8c0-1.263.586-2.39 1.5-3.123" clip-rule="evenodd"/></svg> **Select dataset** and specify the dataset to visualize. If you do not have a dataset, [create one](../dataset/create-dataset.md#create).
   <!-- endsource: en/_includes/datalens/visualization-ref/create-4.md -->
1. Select the **Indicator** chart type.
1. Drag a dimension or measure from the dataset to the **Measure** section. The value is displayed as a number.

## Additional settings {#additional-settings}

### Customizing header display {#indicator-title}

To customize header display:

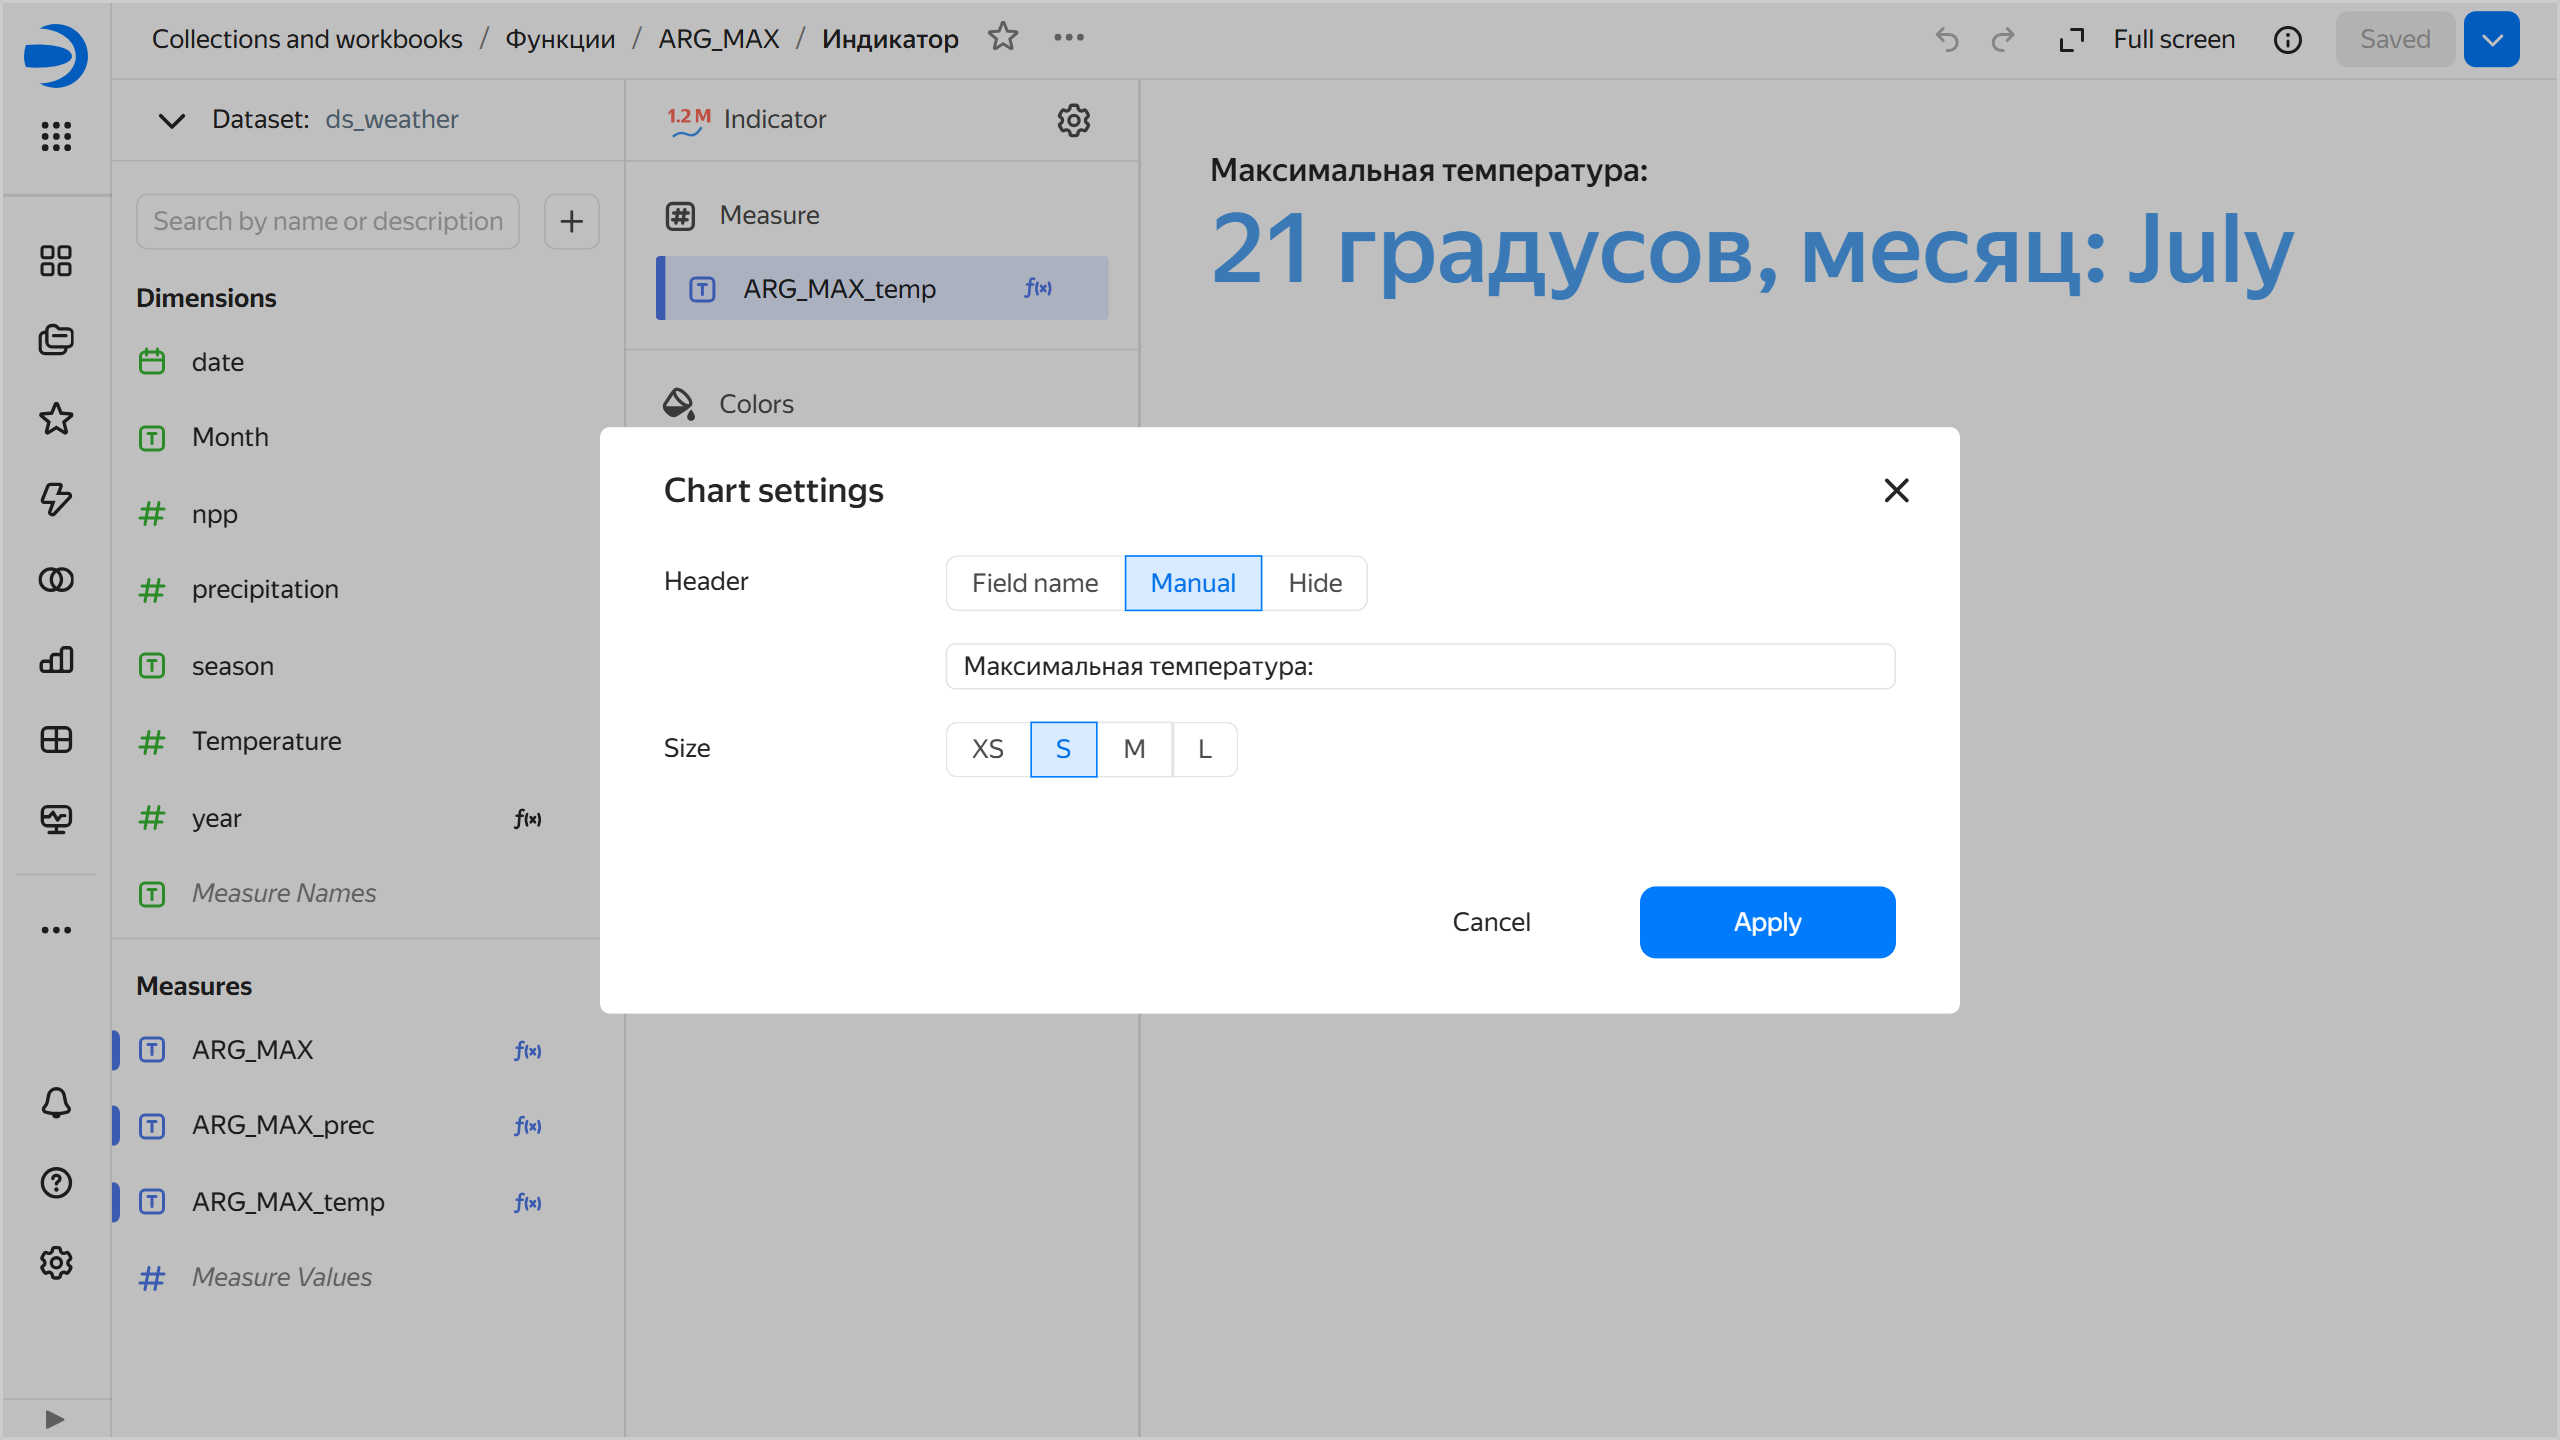
1. At the top of the screen, click <!-- diplodoc:svg ![image](../_assets/console-icons/gear.svg) --><svg xmlns="http://www.w3.org/2000/svg" width="16" height="16" fill="none" viewBox="0 0 16 16"><path fill="currentColor" fill-rule="evenodd" d="M7.199 2H8.8a.2.2 0 0 1 .2.2c0 1.808 1.958 2.939 3.524 2.034a.2.2 0 0 1 .271.073l.802 1.388a.2.2 0 0 1-.073.272c-1.566.904-1.566 3.164 0 4.069a.2.2 0 0 1 .073.271l-.802 1.388a.2.2 0 0 1-.271.073C10.958 10.863 9 11.993 9 13.8a.2.2 0 0 1-.199.2H7.2a.2.2 0 0 1-.2-.2c0-1.808-1.958-2.938-3.524-2.034a.2.2 0 0 1-.272-.073l-.8-1.388a.2.2 0 0 1 .072-.271c1.566-.905 1.566-3.165 0-4.07a.2.2 0 0 1-.073-.27l.801-1.389a.2.2 0 0 1 .272-.072C5.042 5.138 7 4.007 7 2.199c0-.11.089-.199.199-.199M5.5 2.2c0-.94.76-1.7 1.699-1.7H8.8c.94 0 1.7.76 1.7 1.7a.85.85 0 0 0 1.274.735 1.7 1.7 0 0 1 2.32.622l.802 1.388c.469.813.19 1.851-.622 2.32a.85.85 0 0 0 0 1.472 1.7 1.7 0 0 1 .622 2.32l-.802 1.388a1.7 1.7 0 0 1-2.32.622.85.85 0 0 0-1.274.735c0 .939-.76 1.7-1.699 1.7H7.2a1.7 1.7 0 0 1-1.699-1.7.85.85 0 0 0-1.274-.735 1.7 1.7 0 0 1-2.32-.622l-.802-1.388a1.7 1.7 0 0 1 .622-2.32.85.85 0 0 0 0-1.471 1.7 1.7 0 0 1-.622-2.32l.801-1.389a1.7 1.7 0 0 1 2.32-.622A.85.85 0 0 0 5.5 2.2m4 5.8a1.5 1.5 0 1 1-3 0 1.5 1.5 0 0 1 3 0M11 8a3 3 0 1 1-6 0 3 3 0 0 1 6 0" clip-rule="evenodd"/></svg> next to the chart type.
1. Select header display options:

   * `Field name`: Show field name in header.
   * `Manually`: Rename header.
   * `Hide`: Hide header.

1. Click **Apply**.

{% cut "Chart settings window" %}
![indicator-chart-settings](../_assets/datalens/visualization-ref/indicator-chart/indicator-settings.png)

{% endcut %}

### Changing indicator size {#size-setting}

This setting is not available for a field of the `Markup` type. In this case, use [markup functions](../function-ref/markup-functions.md) for formatting as when [creating a complex indicator](#markup-indicator).

To change the indicator size:

1. At the top of the screen, click <!-- diplodoc:svg ![image](../_assets/console-icons/gear.svg) --><svg xmlns="http://www.w3.org/2000/svg" width="16" height="16" fill="none" viewBox="0 0 16 16"><path fill="currentColor" fill-rule="evenodd" d="M7.199 2H8.8a.2.2 0 0 1 .2.2c0 1.808 1.958 2.939 3.524 2.034a.2.2 0 0 1 .271.073l.802 1.388a.2.2 0 0 1-.073.272c-1.566.904-1.566 3.164 0 4.069a.2.2 0 0 1 .073.271l-.802 1.388a.2.2 0 0 1-.271.073C10.958 10.863 9 11.993 9 13.8a.2.2 0 0 1-.199.2H7.2a.2.2 0 0 1-.2-.2c0-1.808-1.958-2.938-3.524-2.034a.2.2 0 0 1-.272-.073l-.8-1.388a.2.2 0 0 1 .072-.271c1.566-.905 1.566-3.165 0-4.07a.2.2 0 0 1-.073-.27l.801-1.389a.2.2 0 0 1 .272-.072C5.042 5.138 7 4.007 7 2.199c0-.11.089-.199.199-.199M5.5 2.2c0-.94.76-1.7 1.699-1.7H8.8c.94 0 1.7.76 1.7 1.7a.85.85 0 0 0 1.274.735 1.7 1.7 0 0 1 2.32.622l.802 1.388c.469.813.19 1.851-.622 2.32a.85.85 0 0 0 0 1.472 1.7 1.7 0 0 1 .622 2.32l-.802 1.388a1.7 1.7 0 0 1-2.32.622.85.85 0 0 0-1.274.735c0 .939-.76 1.7-1.699 1.7H7.2a1.7 1.7 0 0 1-1.699-1.7.85.85 0 0 0-1.274-.735 1.7 1.7 0 0 1-2.32-.622l-.802-1.388a1.7 1.7 0 0 1 .622-2.32.85.85 0 0 0 0-1.471 1.7 1.7 0 0 1-.622-2.32l.801-1.389a1.7 1.7 0 0 1 2.32-.622A.85.85 0 0 0 5.5 2.2m4 5.8a1.5 1.5 0 1 1-3 0 1.5 1.5 0 0 1 3 0M11 8a3 3 0 1 1-6 0 3 3 0 0 1 6 0" clip-rule="evenodd"/></svg> next to the chart type.
1. Select one of the size presets and click **Apply**.

### Changing indicator color {#color-setting}

This setting is not available for a field of the `Markup` type. In this case, use [markup functions](../function-ref/markup-functions.md) for formatting as when [creating a complex indicator](#markup-indicator).

To change the indicator color:

1. Under **Colors**, click <!-- diplodoc:svg ![](../_assets/console-icons/gear.svg) --><svg xmlns="http://www.w3.org/2000/svg" width="16" height="16" fill="none" viewBox="0 0 16 16"><path fill="currentColor" fill-rule="evenodd" d="M7.199 2H8.8a.2.2 0 0 1 .2.2c0 1.808 1.958 2.939 3.524 2.034a.2.2 0 0 1 .271.073l.802 1.388a.2.2 0 0 1-.073.272c-1.566.904-1.566 3.164 0 4.069a.2.2 0 0 1 .073.271l-.802 1.388a.2.2 0 0 1-.271.073C10.958 10.863 9 11.993 9 13.8a.2.2 0 0 1-.199.2H7.2a.2.2 0 0 1-.2-.2c0-1.808-1.958-2.938-3.524-2.034a.2.2 0 0 1-.272-.073l-.8-1.388a.2.2 0 0 1 .072-.271c1.566-.905 1.566-3.165 0-4.07a.2.2 0 0 1-.073-.27l.801-1.389a.2.2 0 0 1 .272-.072C5.042 5.138 7 4.007 7 2.199c0-.11.089-.199.199-.199M5.5 2.2c0-.94.76-1.7 1.699-1.7H8.8c.94 0 1.7.76 1.7 1.7a.85.85 0 0 0 1.274.735 1.7 1.7 0 0 1 2.32.622l.802 1.388c.469.813.19 1.851-.622 2.32a.85.85 0 0 0 0 1.472 1.7 1.7 0 0 1 .622 2.32l-.802 1.388a1.7 1.7 0 0 1-2.32.622.85.85 0 0 0-1.274.735c0 .939-.76 1.7-1.699 1.7H7.2a1.7 1.7 0 0 1-1.699-1.7.85.85 0 0 0-1.274-.735 1.7 1.7 0 0 1-2.32-.622l-.802-1.388a1.7 1.7 0 0 1 .622-2.32.85.85 0 0 0 0-1.471 1.7 1.7 0 0 1-.622-2.32l.801-1.389a1.7 1.7 0 0 1 2.32-.622A.85.85 0 0 0 5.5 2.2m4 5.8a1.5 1.5 0 1 1-3 0 1.5 1.5 0 0 1 3 0M11 8a3 3 0 1 1-6 0 3 3 0 0 1 6 0" clip-rule="evenodd"/></svg>.
1. Select a color pallete and color, then click **Apply**.

### Creating a complex indicator {#markup-indicator}

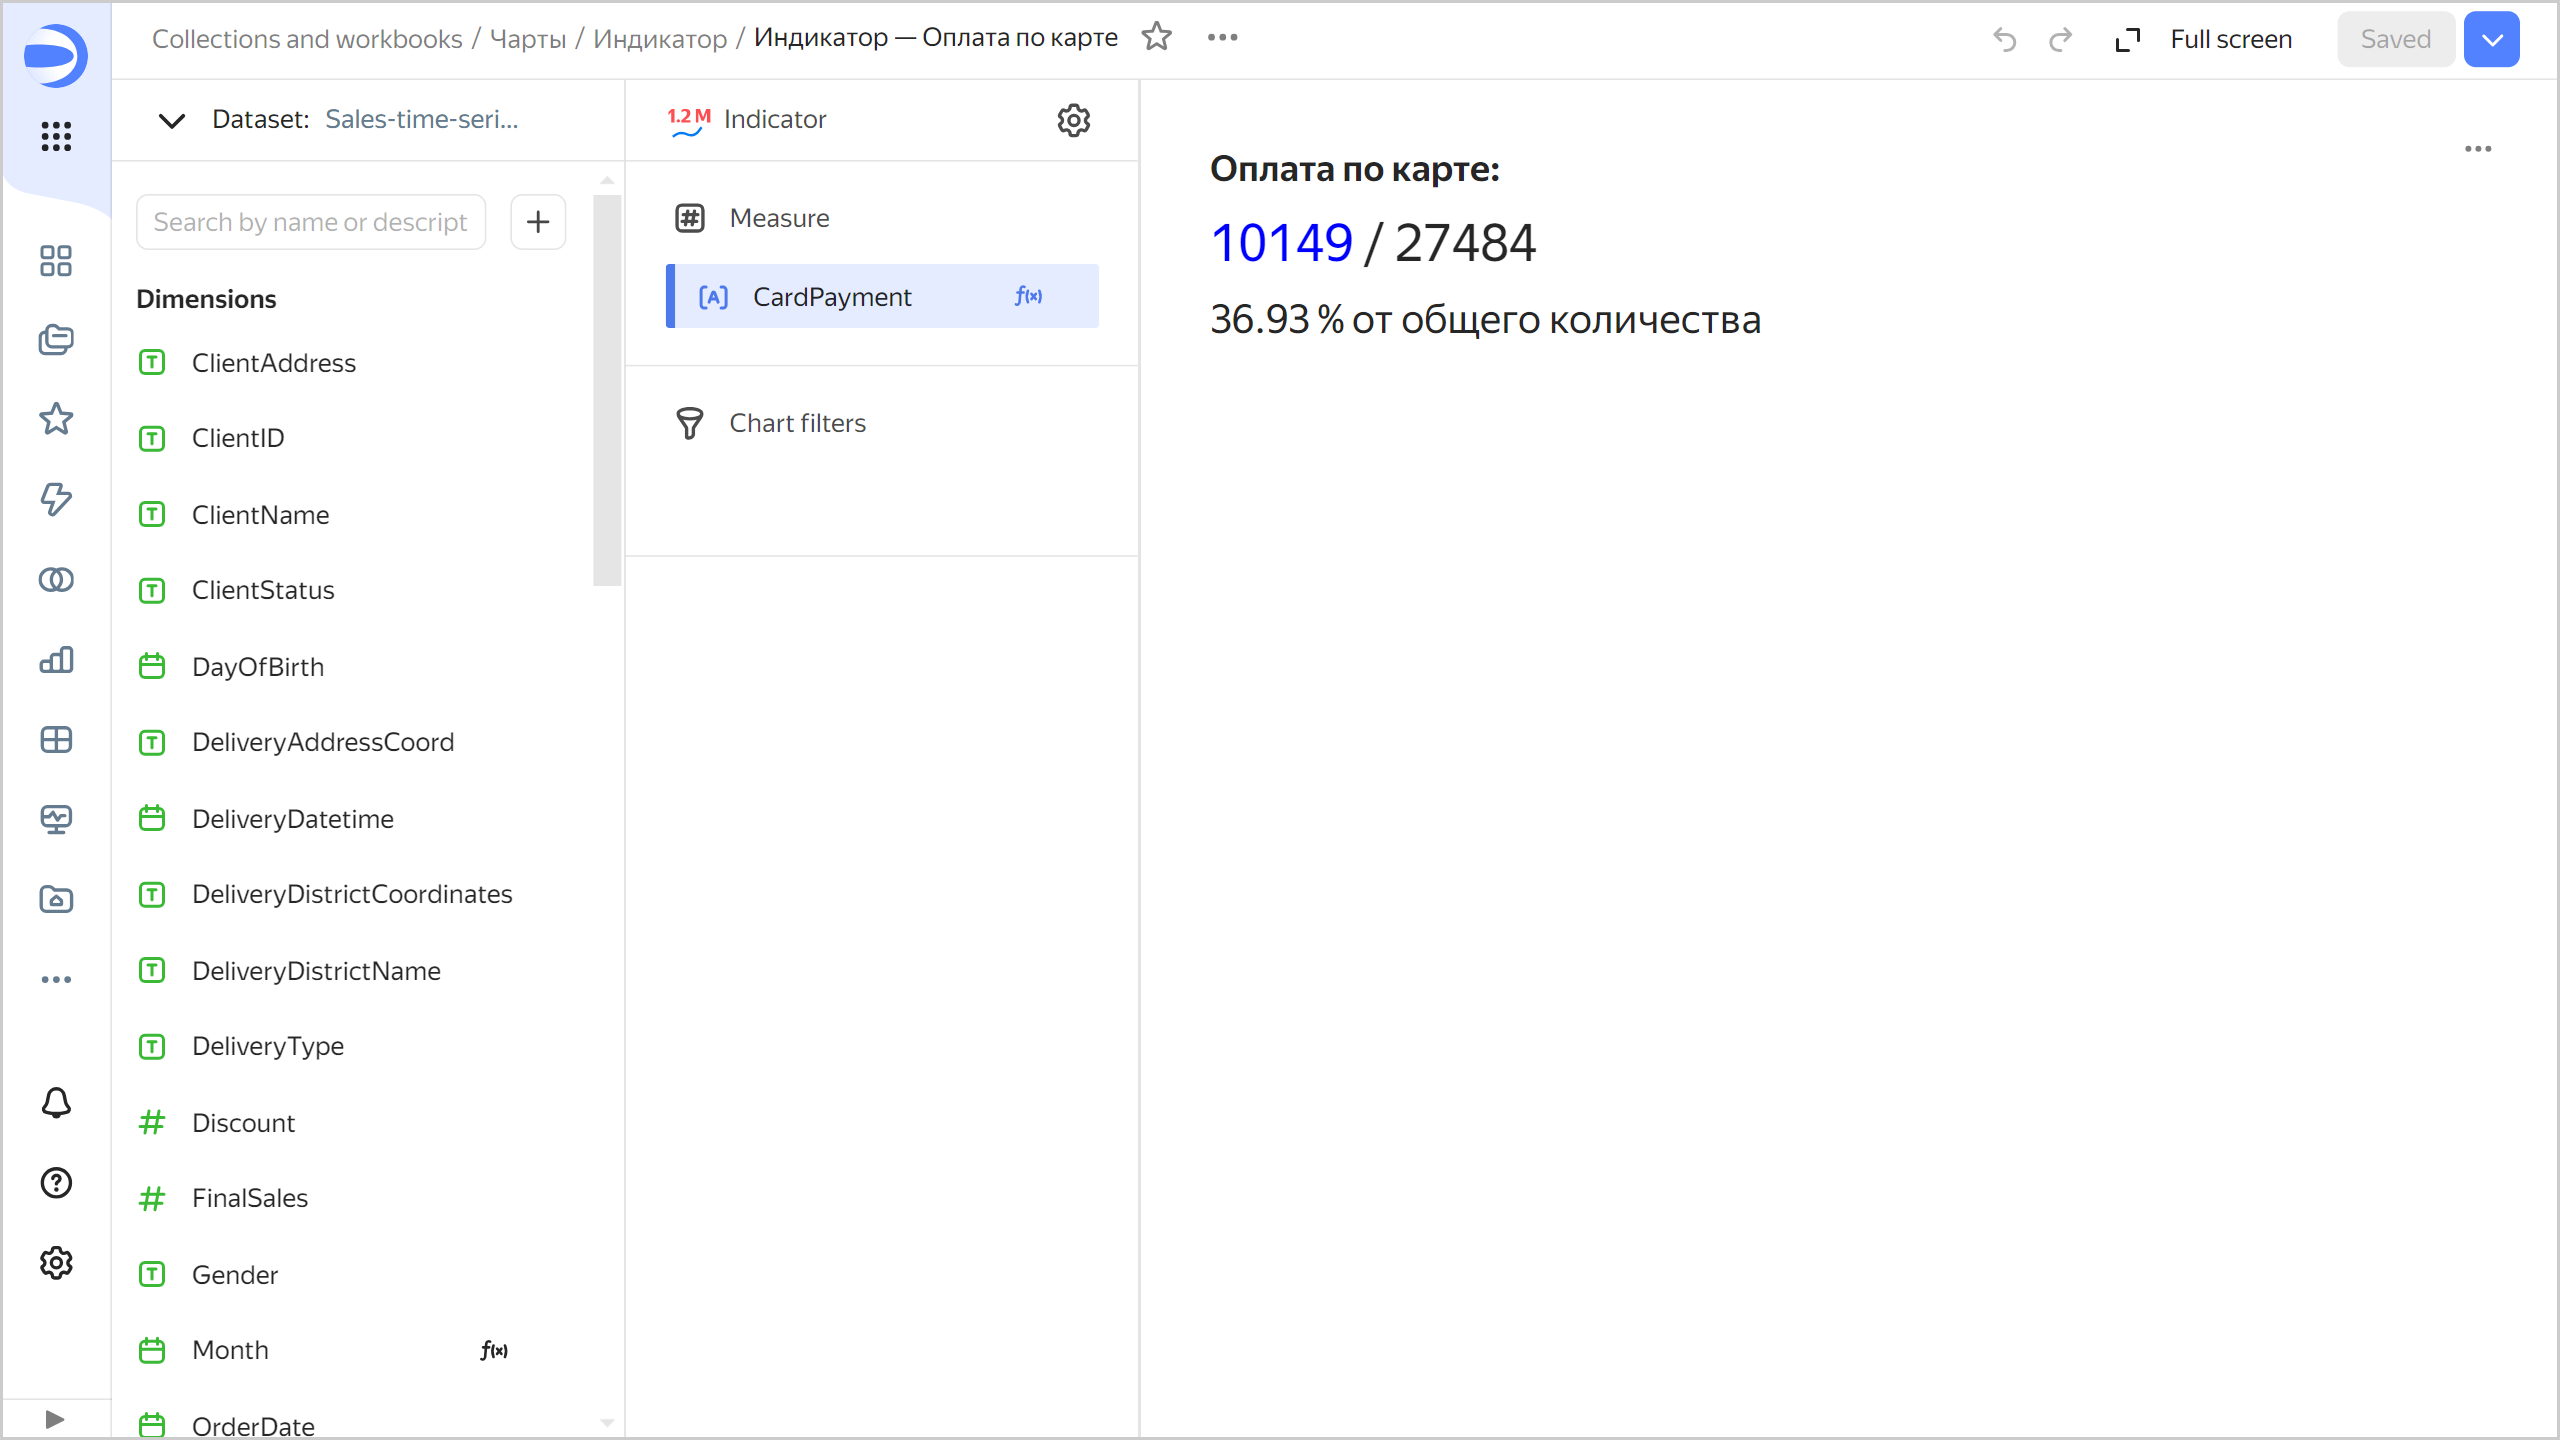
To create a complex indicator representing a number of measures, use the [markup functions](../function-ref/markup-functions.md). Proceed as follows:

1. Create a [calculated field](../concepts/calculations/index.md) using the markup functions.
1. Drag a field from **Measures** to the indicator's **Measure** section.

{% cut "Text formatting" %}

```markdown
BOLD(SIZE('Payment by card: ', '18px')) +
BR() + BR() +
SIZE(COLOR(STR(COUNTD_IF([OrderID], [PaymentType]='Bank card')),'blue') + ' / ' + STR(COUNTD([OrderID])), '26px') +
BR() + BR() +
SIZE(STR(ROUND(COUNTD_IF([OrderID], [PaymentType]='Bank card')/COUNTD([OrderID])*100, 2)) +
' %  in total', '20px')
```
![indicator-fonts](../_assets/datalens/visualization-ref/indicator-chart/indicator-fonts.png)

{% endcut %}

{% cut "Indicator with multiple measures" %}

```markdown
SIZE('Amount: ', '18px') +
BR() + BR() +
COLOR(SIZE('- categories: ' + STR(COUNTD([ProductCategory])), '18px'), '#BE2443') +
BR() +
COLOR(SIZE('- subcategories: ' + STR(COUNTD([ProductSubcategory])), '18px'), 'blue') +
BR() +
COLOR(SIZE('- brands: ' + STR(COUNTD([ProductBrend])), '18px'), 'green') +
BR() +
COLOR(SIZE('- products: ' + STR(COUNTD([ProductName])), '18px'), '#FF7E00')
```
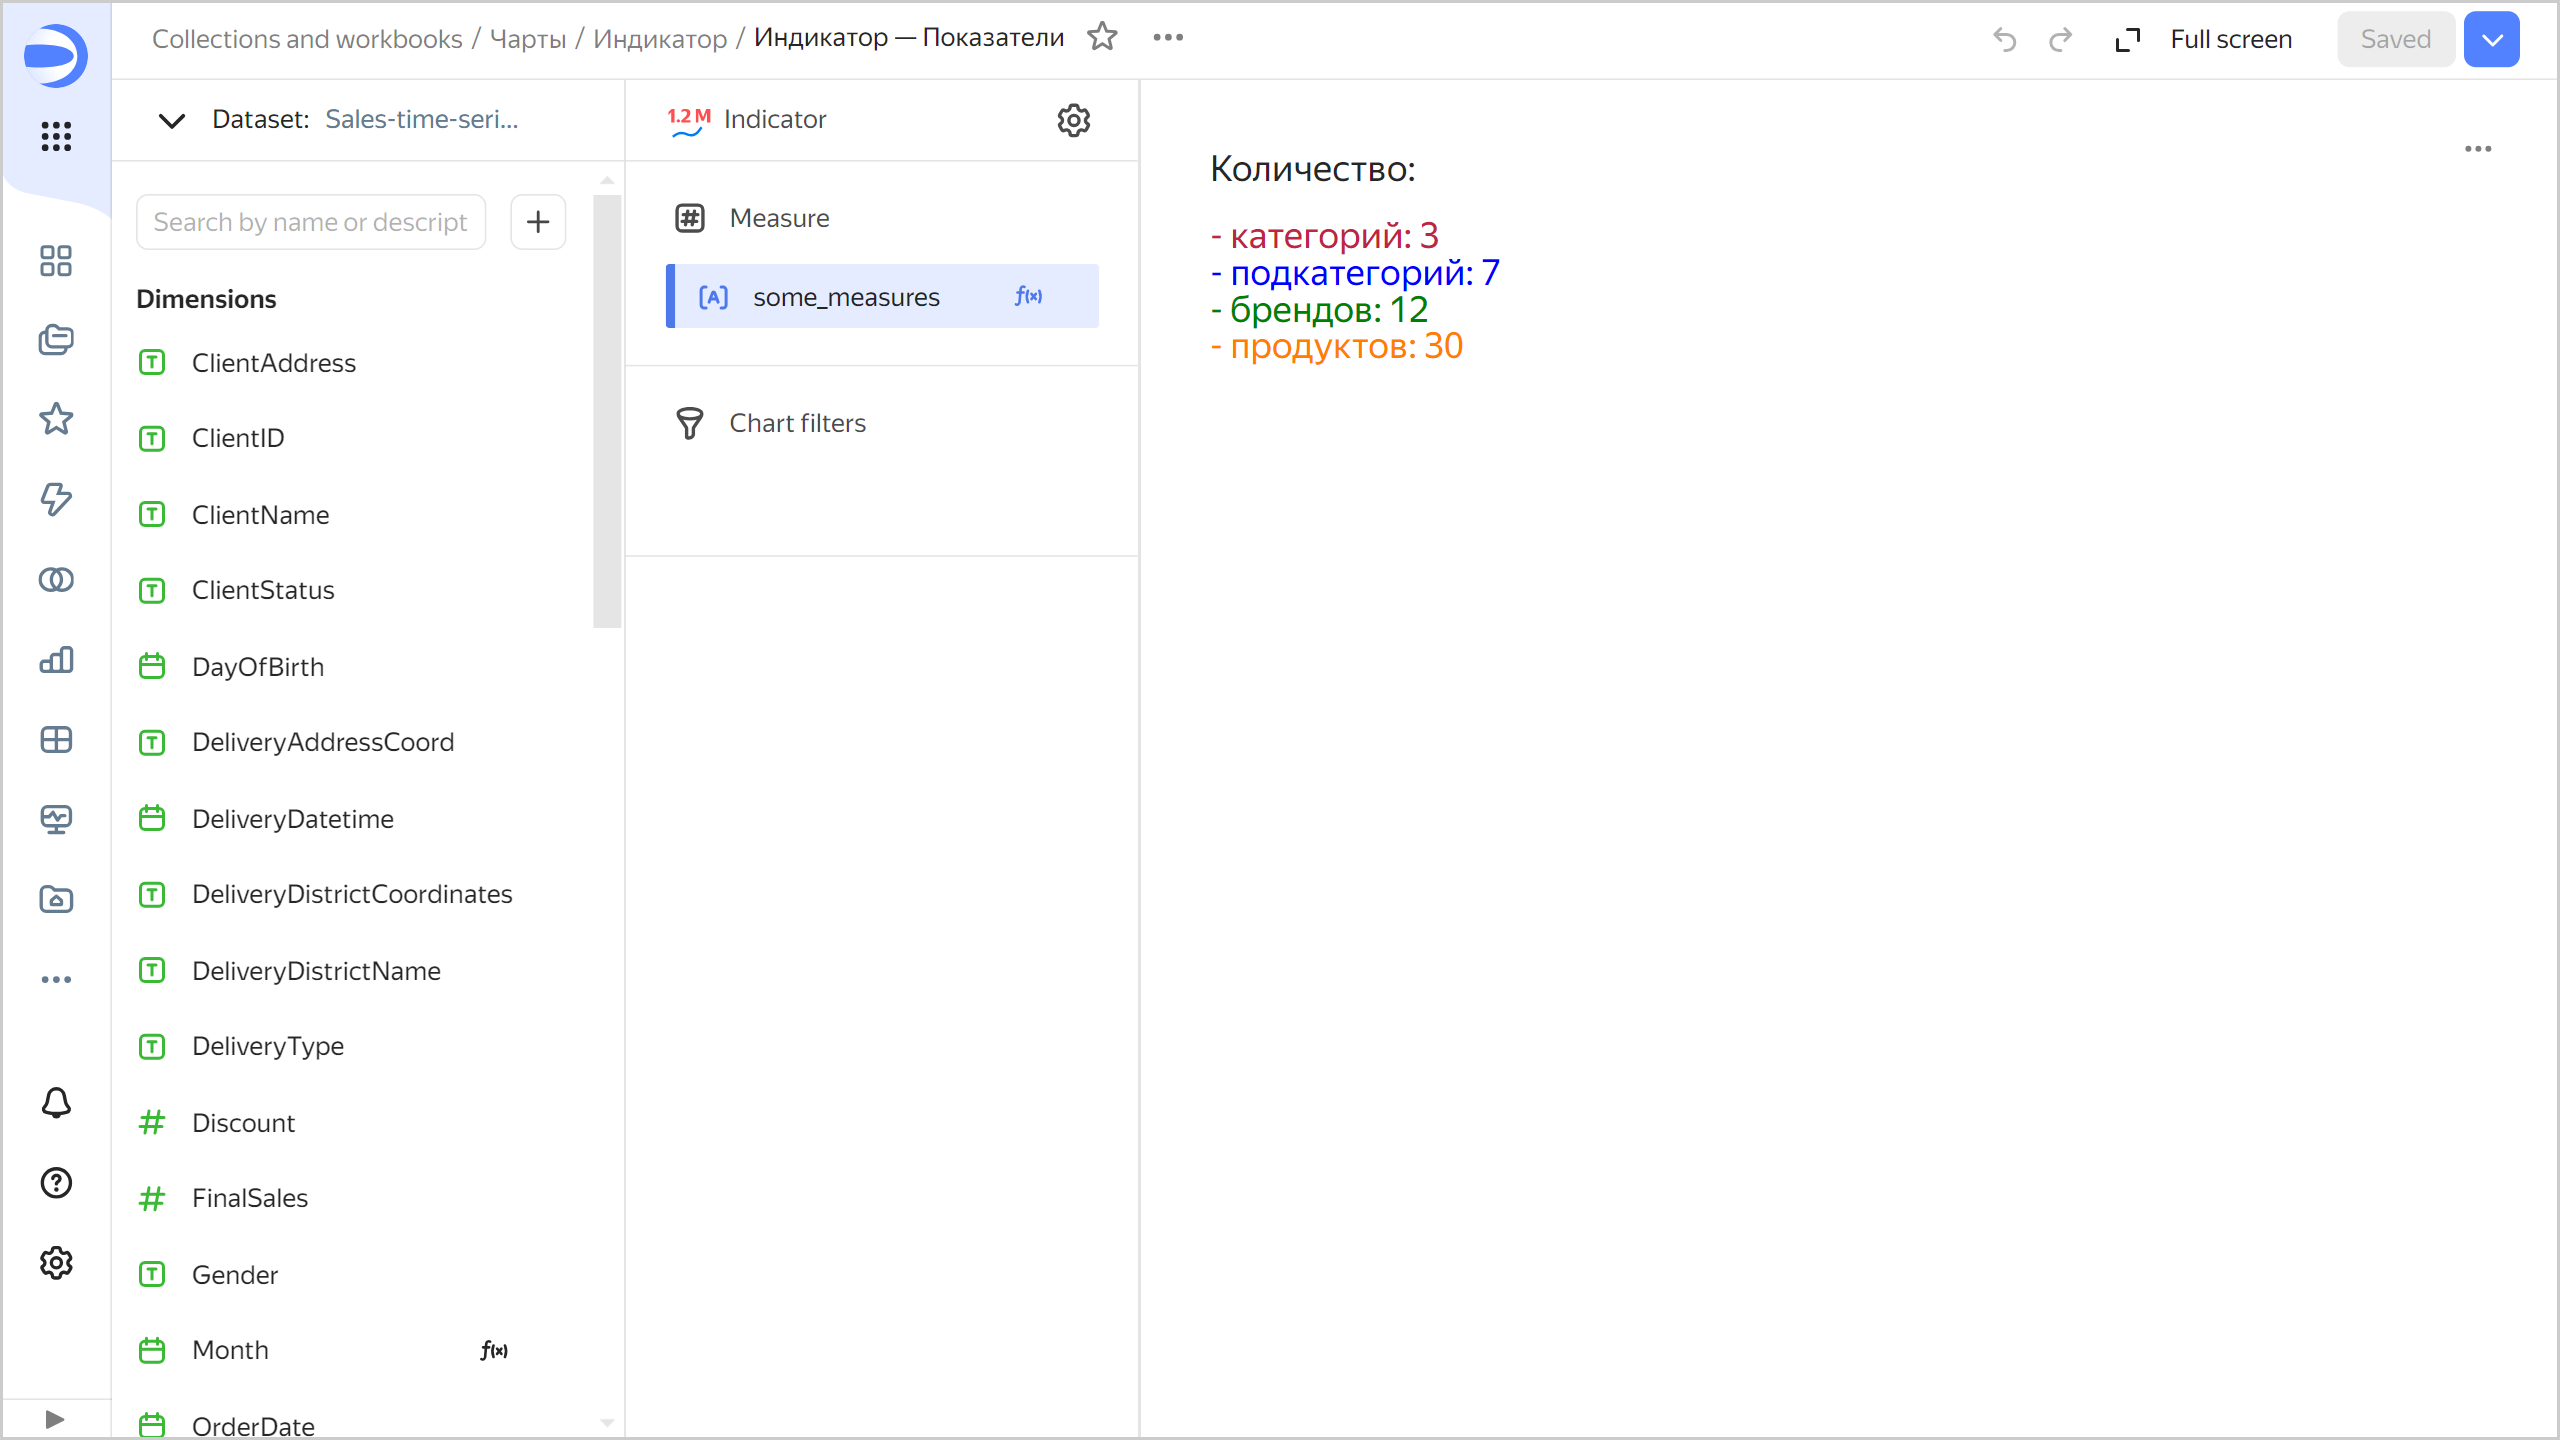
![indicator-some-measures](../_assets/datalens/visualization-ref/indicator-chart/indicator-some-measures.png)

{% endcut %}

{% cut "Indicator with a measure by category" %}

```markdown
SIZE('Sales: ' + COLOR(STR([Sales])+ ' ₽', 'green'), '26px') +
BR() +
COLOR(" ▲ ", "green")+": More than ₽50,000,000  | " + COLOR(" ▼ ", "red") + ": ₽50,000,000 or less" +
BR() + BR() +
SIZE(
    COLOR('| ' + STR(SUM_IF([Sales],[ProductCategory]='Home appliances'))+ ' ₽ | ', 'blue') + 
    COLOR(if(SUM_IF([Sales],[ProductCategory]='Home appliances')>50,000,000, " ▲ "," ▼ "), if(SUM_IF([Sales],[ProductCategory]='Home appliances')>50,000,000,"green", "red")),
    '20px') +
BR() + 'Home appliances' +
BR() + BR() +
SIZE(
    COLOR('| ' + STR(SUM_IF([Sales],[ProductCategory]='Household chemicals'))+ ' ₽ | ', 'green') + 
    COLOR(if(SUM_IF([Sales],[ProductCategory]='Household chemicals')>50,000,000, " ▲ "," ▼ "), if(SUM_IF([Sales],[ProductCategory]='Household chemicals')>50,000,000,"green", "red")),
    '20px') +
BR() + 'Household chemicals' +
BR() + BR() +
SIZE(
    COLOR('| ' + STR(SUM_IF([Sales],[ProductCategory]='Household products'))+ ' ₽ | ', 'violet') + 
    COLOR(if(SUM_IF([Sales],[ProductCategory]='Household products')>50,000,000, " ▲ "," ▼ "), if(SUM_IF([Sales],[ProductCategory]='Household products')>50,000,000,"green", "red")),
    '20px') +
BR() + 'Household products'
```
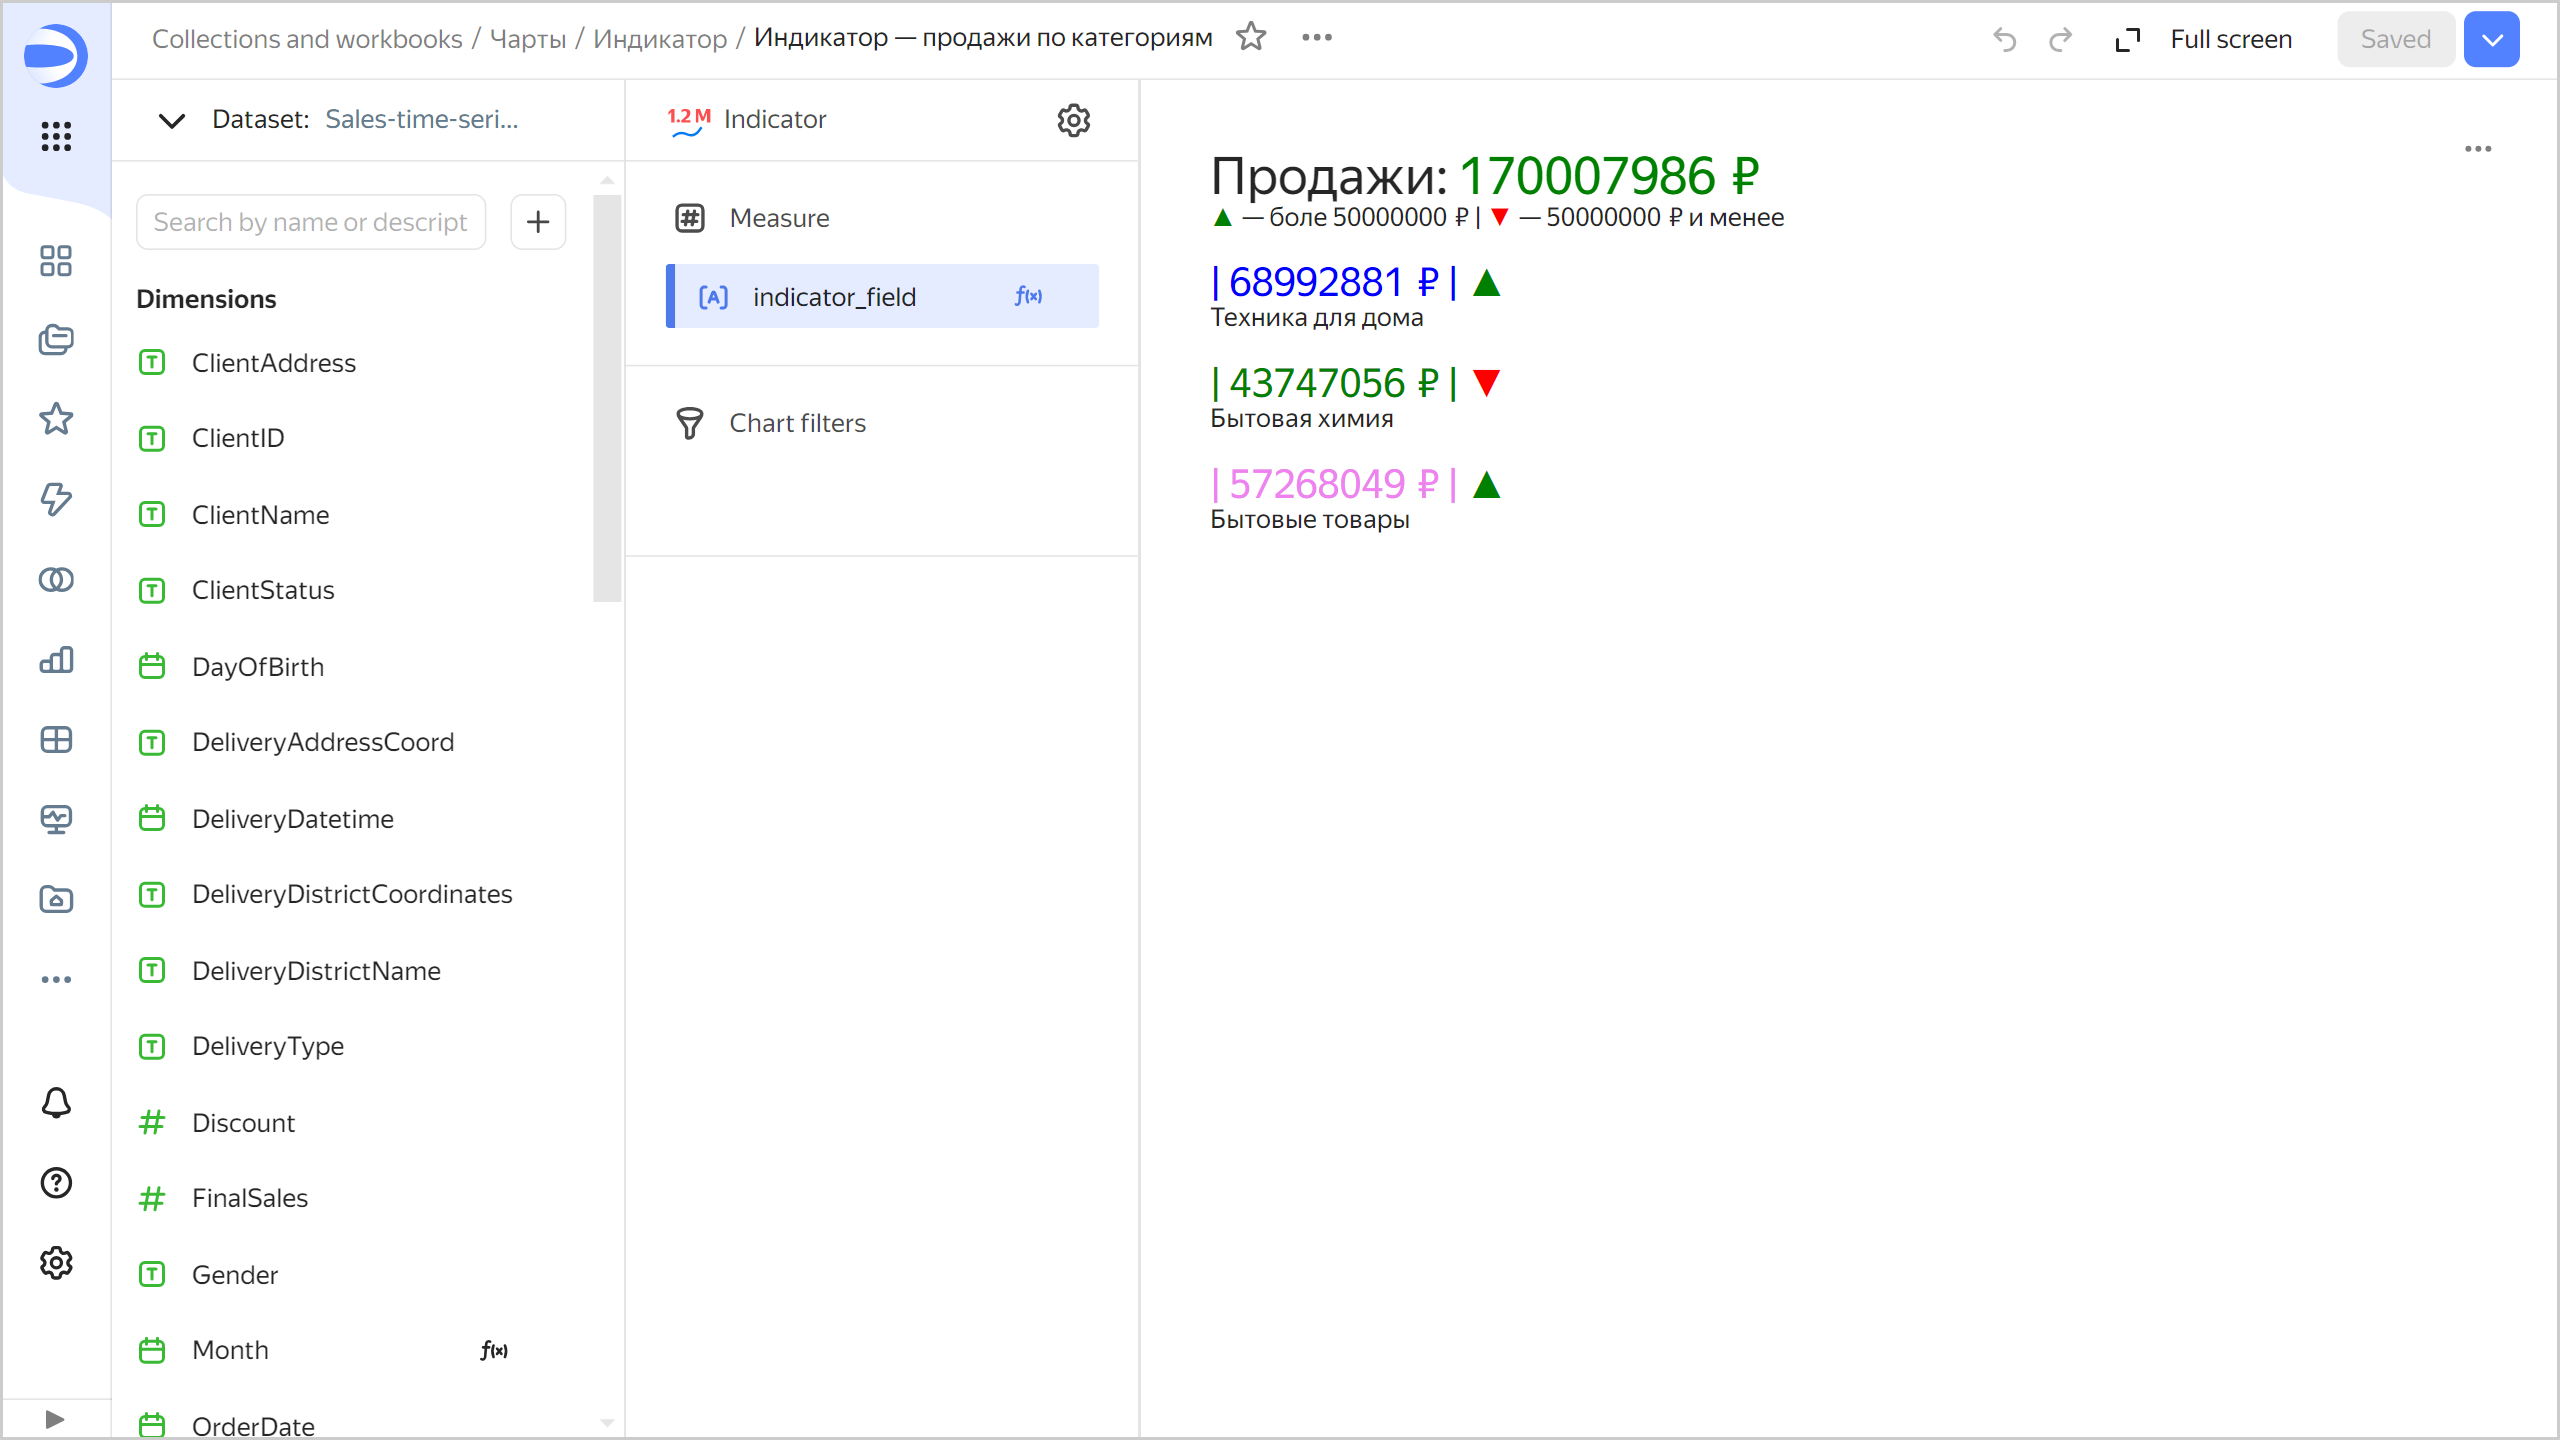
![indicator-categories](../_assets/datalens/visualization-ref/indicator-chart/indicator-categories.png)

{% endcut %}

{% cut "Indicator with an image" %}

```markdown
IMAGE('https://storage.yandexcloud.net/dl--********//datalens.jpg', 32, 32, 'alt-text-1') +
COLOR(SIZE('| ' + STR(SUM_IF([Usage],[Service]='DataLens')), '32px'), '#AEC5F3') +
BR()+
COLOR(SIZE('DataLens', '20px'), '#AEC5F3')+
BR()+
BR()+
IMAGE('https://storage.yandexcloud.net/dl--********//powerbi.jpg', 32, 32, 'alt-text-1') +
" " + COLOR(SIZE('| ' + STR(SUM_IF([Usage],[Service]='Power BI')), '32px'), '#B8A754')+
BR()+
COLOR(SIZE('Power BI', '20px'), '#B8A754')+
BR()+
BR()+
IMAGE('https://storage.yandexcloud.net/dl-********/tableu.jpg', 32, 32, 'alt-text-1') +
" " + COLOR(SIZE('| ' + STR(SUM_IF([Usage],[Service]='Tableau')), '32px'), '#4D5DAB')+
BR()+
COLOR(SIZE('Tableau', '20px'), '#4D5DAB')
```
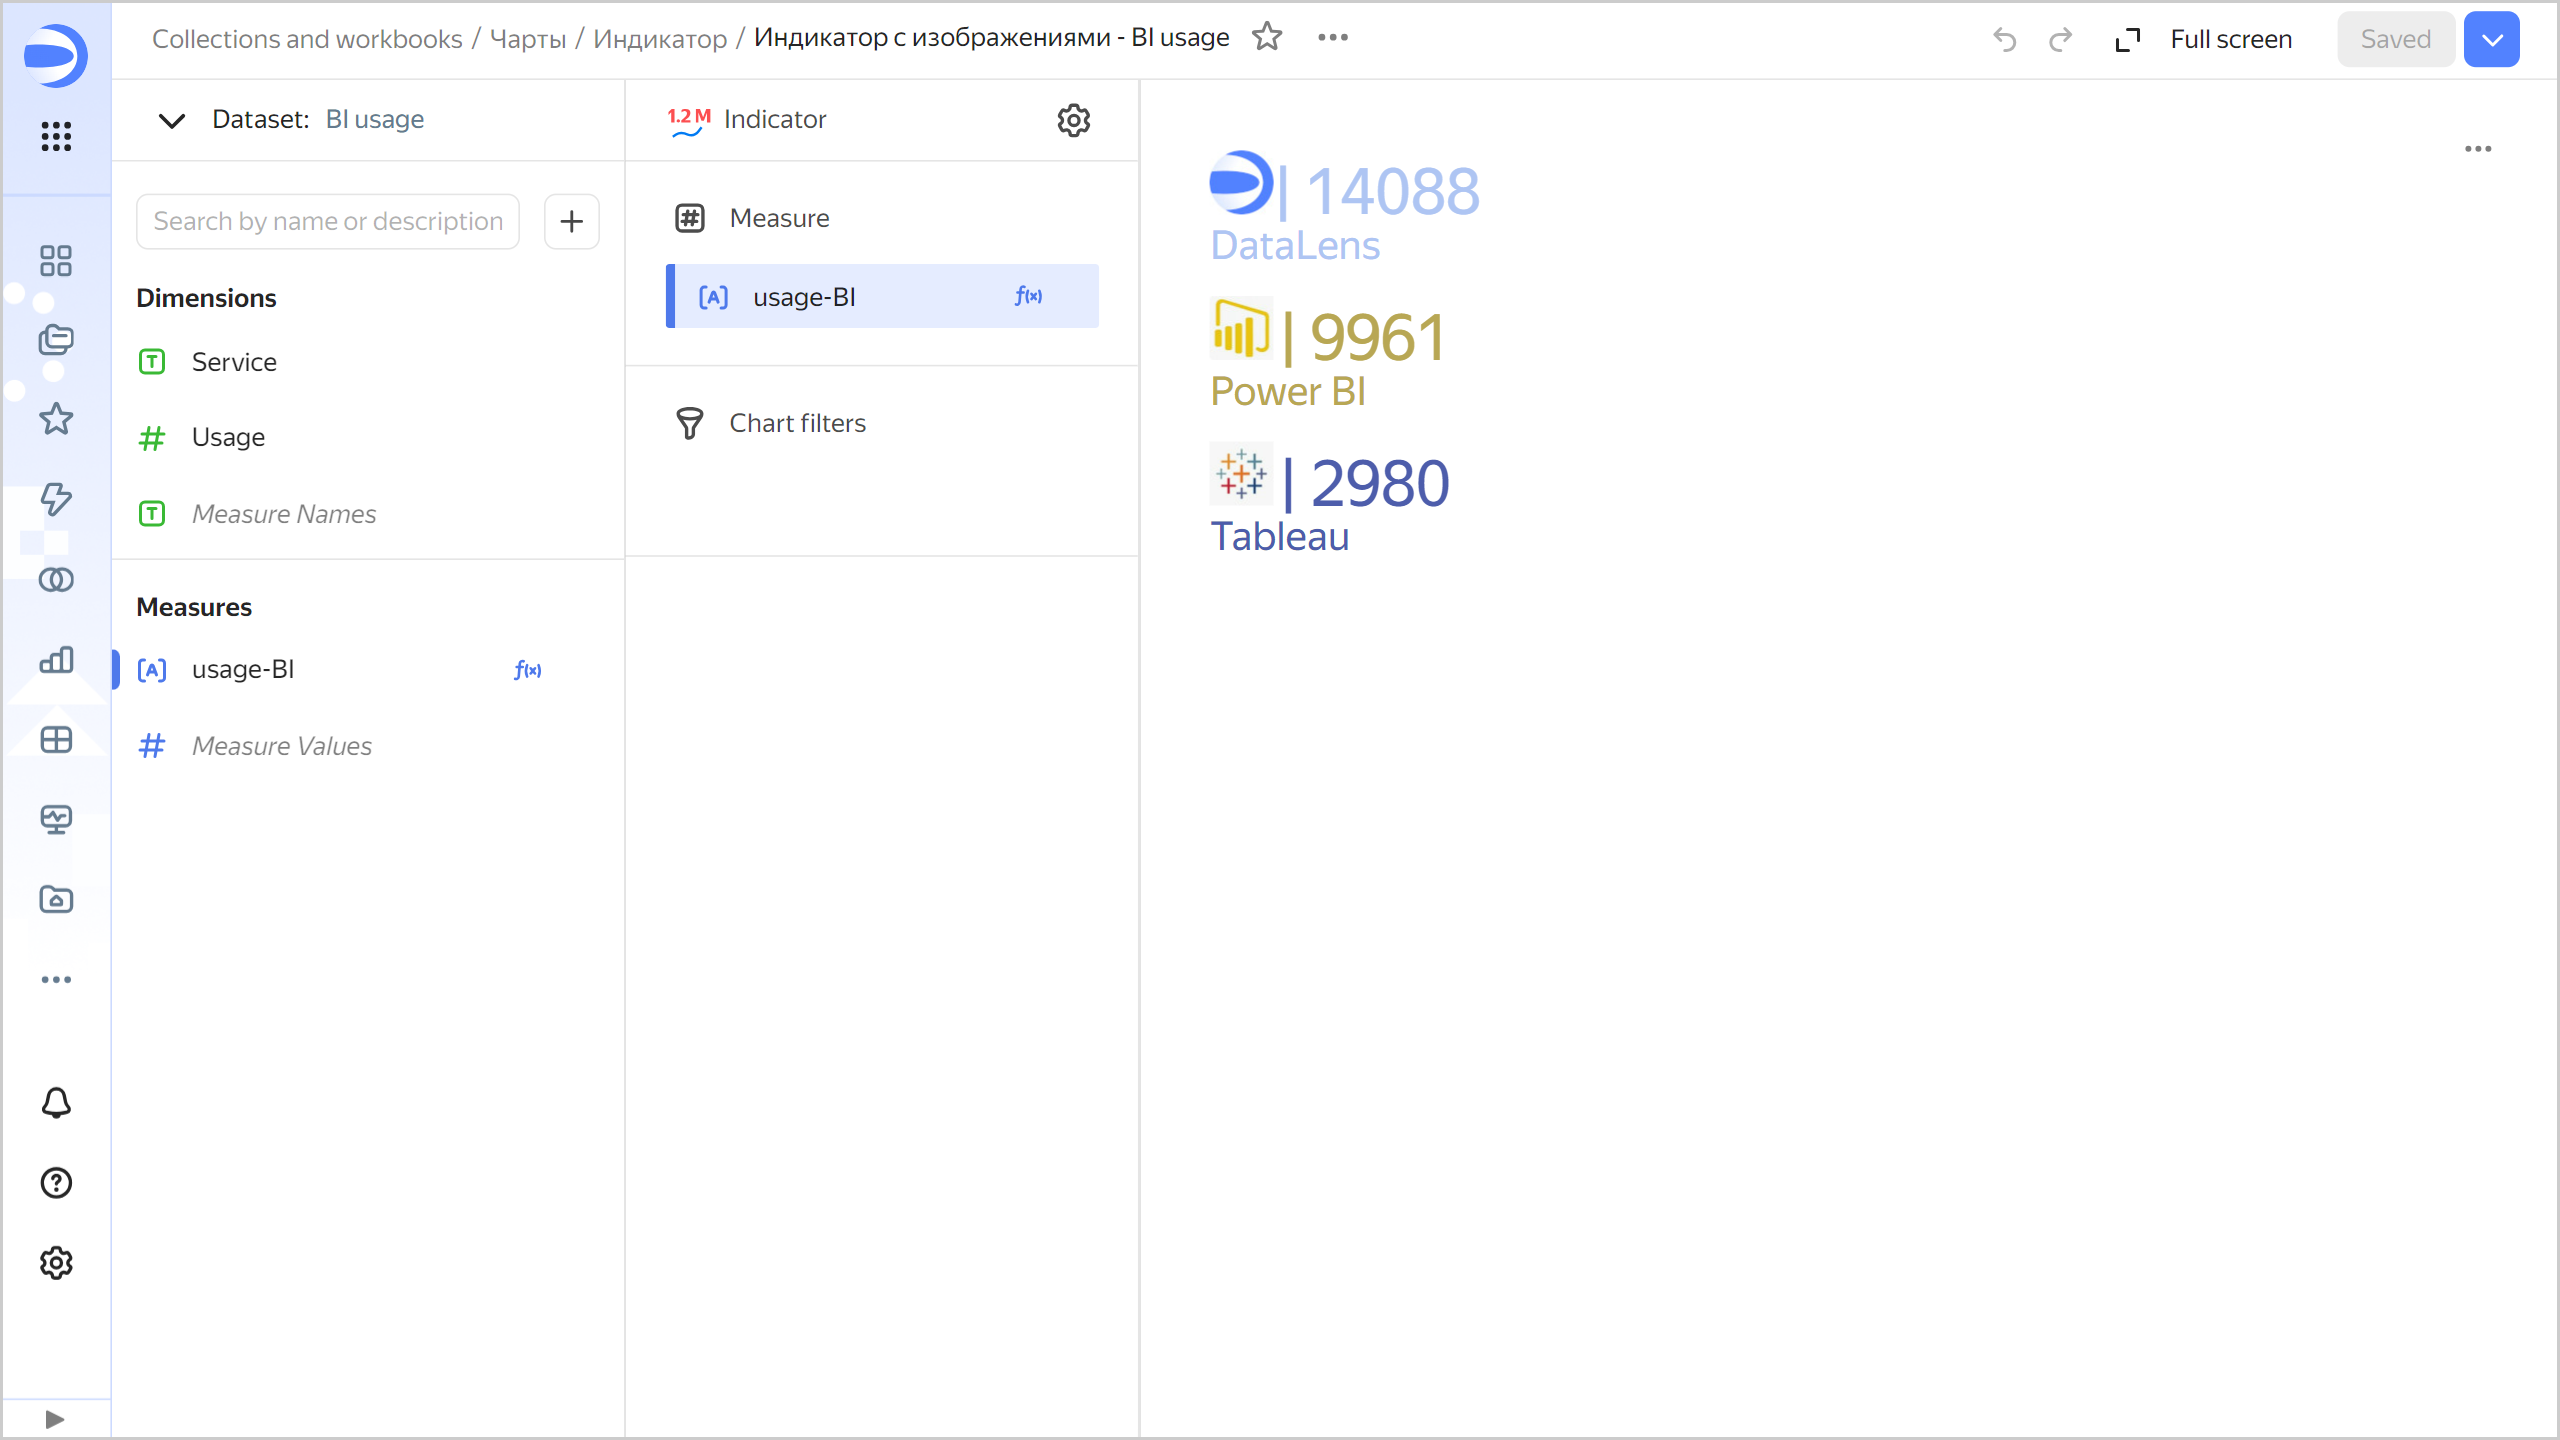
![indicator-some-measures](../_assets/datalens/visualization-ref/indicator-chart/indicator-image.png)

{% endcut %}

## Recommendations {#recommendations}

* Use emojis when calculating indicator values to make them more informative.
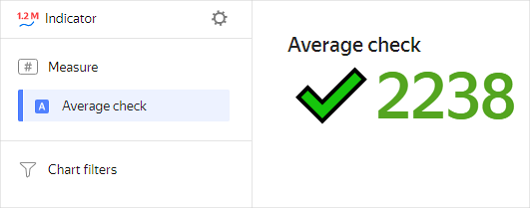
  ![indicator-chart-emoji](../_assets/datalens/visualization-ref/indicator-chart/indicator-chart-emoji.png)

  This indicator chart uses a calculated field with the following formula: `IF([Average spend]>2200, CONCAT("✔️",STR(ROUND([Average spend]))),CONCAT("🔻",STR(round([Average spend]))))`.

* Describe the context to make it clear what indicators mean.
  ![indicator-chart-context](../_assets/datalens/visualization-ref/indicator-chart/indicator-chart-context.png)

<!-- source: en/_includes/datalens/visualization-ref/see-also-sub.md -->
#### Useful links {#see-also}

* [Creating a dashboard in DataLens On-premises](../operations/dashboard/create.md)
* [Adding a chart to a dashboard in DataLens On-premises](../operations/dashboard/add-chart.md)
* [Adding a selector to a dashboard in DataLens On-premises](../operations/dashboard/add-selector.md)
<!-- endsource: en/_includes/datalens/visualization-ref/see-also-sub.md -->